Measuring Insight into Multi-dimensional Data from a Combination of a Scatterplot Matrix and a HyperSlice Visualization

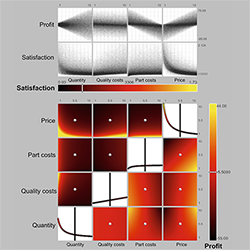
Understanding multi-dimensional data and in particular multi-dimensional dependencies is hard. Information visualization can help to understand this type of data. Still, the problem of how users gain insights from such visualizations is not well understood. Both the visualizations and the users play a role in understanding the data. In a case study, using both, a scatterplot matrix and a HyperSlice with six-dimensional data, we asked 16 participants to think aloud and measured insights during the process of analyzing the data. The amount of insights was strongly correlated with spatial abilities. Interestingly, all users were able to complete an optimization task independently of self-reported understanding of the data.
@Inbook{CaleroValdez2017,
author="Calero Valdez, Andr{\'e}
and Gebhardt, Sascha
and Kuhlen, Torsten W.
and Ziefle, Martina",
editor="Duffy, Vincent G.",
title="Measuring Insight into Multi-dimensional Data from a Combination of a Scatterplot Matrix and a HyperSlice Visualization",
bookTitle="Digital Human Modeling. Applications in Health, Safety, Ergonomics, and Risk Management: Health and Safety: 8th International Conference, DHM 2017, Held as Part of HCI International 2017, Vancouver, BC, Canada, July 9-14, 2017, Proceedings, Part II",
year="2017",
publisher="Springer International Publishing",
address="Cham",
pages="225--236",
isbn="978-3-319-58466-9",
doi="10.1007/978-3-319-58466-9_21",
url="http://dx.doi.org/10.1007/978-3-319-58466-9_21"
}

