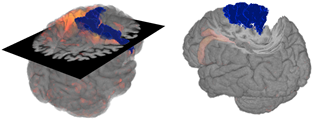
Poster Interactive Visualization of Brain Volume Changes

The visual analysis of brain volume data by neuroscientists is commonly done in 2D coronal, sagittal and transversal views, limiting the visualization domain from potentially three to two dimensions. This is done to avoid occlusion and thus gain necessary context information. In contrast, this work intends to benefit from all spatial information that can help to understand the original data. Example data of a patient with brain degeneration are used to demonstrate how to enrich 2D with 3D data. To this end, two approaches are presented. First, a conventional 2D section in combination with transparent brain anatomy is used. Second, the principle of importance-driven volume rendering is adapted to allow a direct line-of-sight to relevant structures by means of a frustum-like cutout.

