
Past Research Areas
While examples of our current reseach projects are presented on our main page, this page lists projects of our past research. If you are interested in these projects or in a cooperation, please contact us via e-mail: info@vr.rwth-aachen.de
Examples of Current Research Projects
Selected projects of our current research can be found here.Examples of Past Research Projects
Acoustics
Aerospace
Architecture & Civil Engineering
- Cluster of Excellence - Immersive Virtual Reality Support for Factory Layout Planning Processes
- FuEco: Combined Stress Assessment in Urban Spaces
- Scene Analysis to Improve Navigation trough Virtual Worlds
Arts
Chemistry
- 3D Interactive Graph Visualization
- GTECS3D: Graph-Theoretical Evaluation of Crystal Structures in 3D
Computational Engineering Science
- Interactive Visualization of Blood Flow in a Ventricular Assist Device
- Rhinomodell: Modeling the Aerodynamics of Nasal Airflow
- Tracking of Space-Filling Structures in Small-Scale Turbulence
- Visualization of Uncertain Geothermal Simulation Data
General HCI Research
- Desk-Based Virtual Reality
- HMI of the Future – Innovative Human-Machine Interfaces for Inspection and Diagnose Systems
- Intentional Forgetting of Everyday Work Behaviour - Assessment, Formalization and Integration into Interactive Systems
- Refresher Interventions and Their Impact on Skill Retention of Complex, Dynamic Process Control Tasks for Longer Periods of Nonuse Considering Mental Workload and Situation Awareness
Healthcare & Medicine
- Regional Anesthesia Simulator and Assistant
- Ultrasound Image Simulation for Training of Needle Insertion Procedures
- Virtual Reality-based Medical Training Simulator for Bilateral Sagittal Split Osteotomy
- Interactive Visualization of Blood Flow in a Ventricular Assist Device
- Rhinomodell: Modeling the Aerodynamics of Nasal Airflow
- Interactive Heart Physiology in Virtual Reality
High Performance Computing
Geophysics
Production Technology & Engineering
- CAVIR: Correspondence Analysis in Virtual Reality
- Cluster of Excellence - Integrative Simulation Platform and Explorative Multiple Dataset Analysis
- Cluster of Excellence - Immersive Virtual Reality Support for Factory Layout Planning Processes
- Cluster of Excellence - memoSlice: Visualization of Metamodels for Manufacturing Processes
- Navigating in Multibody Simulation Data
Neuroscience
- 3D Interactive Graph Visualization
- Large Data Volume Rendering
- Immersive Visualization - Visualization of Polarized Light Imaging Data
- VisNEST – Interactive Exploration of Neural Networks with Structural Plasticity
Sound is an important aspect of believable and immersive Virtual Reality applications. However, a major challenge is the synthesis of sounds to be played. The common approach is pre-recording of sound samples, and playing them back at run-time. However, this is often impractical for highly interactive environments due to the high number and variation of possible sounds. Especially with physically simulated objects, many different sounds can be generated by collisions. Such collision sounds depend on different factors like the shape, size, and material of the objects, as well as the positions, strength, and temporal distribution of the collision forces. Especially the latter aspects are difficult to reproduce with sound samples.
Instead, modal sound synthesis can interactively generate contact sounds from the physical properties of objects. Collision forces excite modes in an object, which represent characteristic vibrations. These vibrations are then translated to sound. This approach allows a physically-based computation of sounds from an object’s geometry, material, and impact forces, and thus requires little manual design effort.
However, modal sound synthesis requires the compute the mode by a modal analysis, which is computationally expensive, and thus usually performed in a pre-processing step. However, some objects – like shards from braking glass - can be generated at runtime, so that no pre-processing is possible. Instead, a modal analysis has to be computed at run-time. To still be fast enough, we use different levels of detail to quickly compute approximate modal data, which are replaced with higher-quality results later on. By using geometric approximations that are tailored to the requirements of the modal analysis, we can compute the first result in less than 10ms.
Additionally, when sounding objects are in contact with one another, their vibrating surfaces lead to coupling effects – like damping a wine glass with fingers. Due to the high-frequency deformations, these coupling effects can currently not be simulated in real-time. To achieve this goal, we use heuristic damping as well as localized, approximate real-time simulation of the high-frequency surface collisions to simulate such effects.
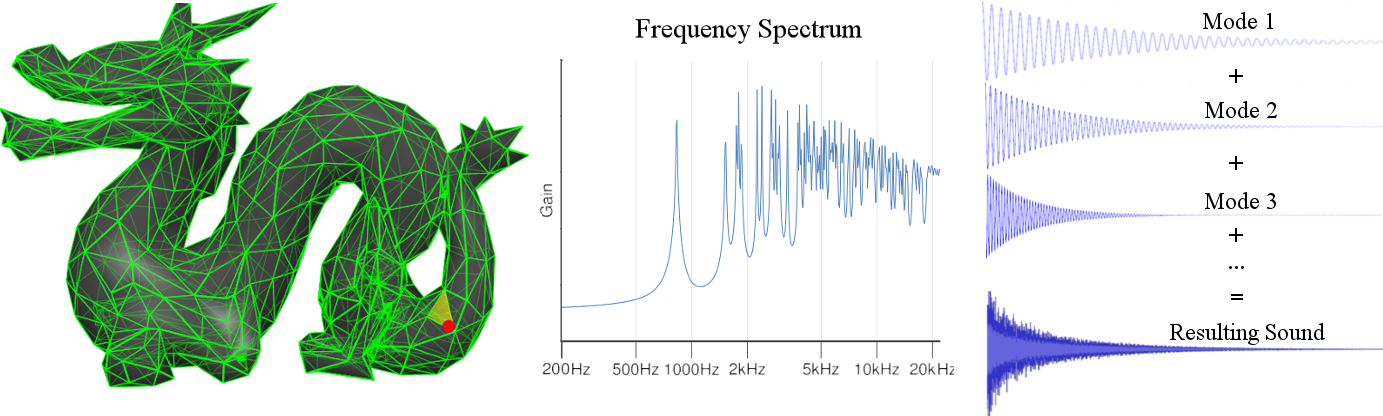 |
| Modal Sound Synthesis creates sounds from an object’s physical representation by combining modal vibrations. |
Back to project list - Back to top
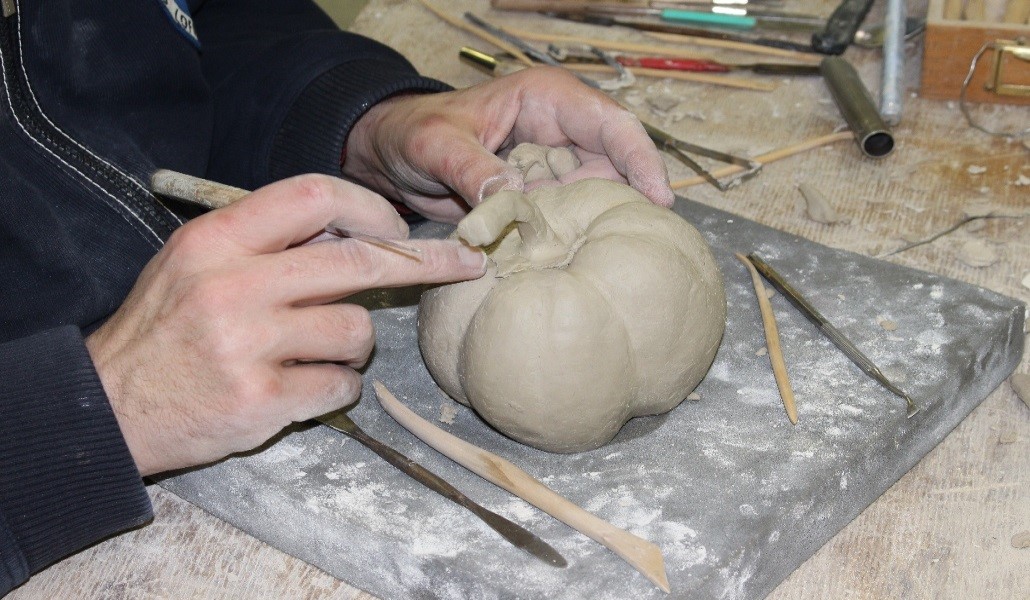
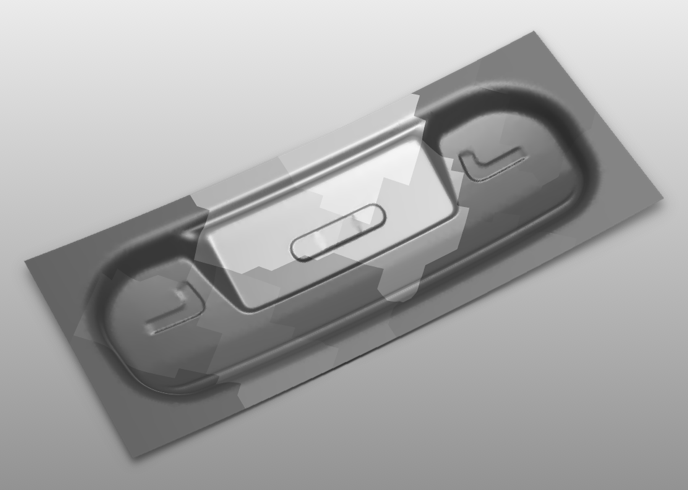
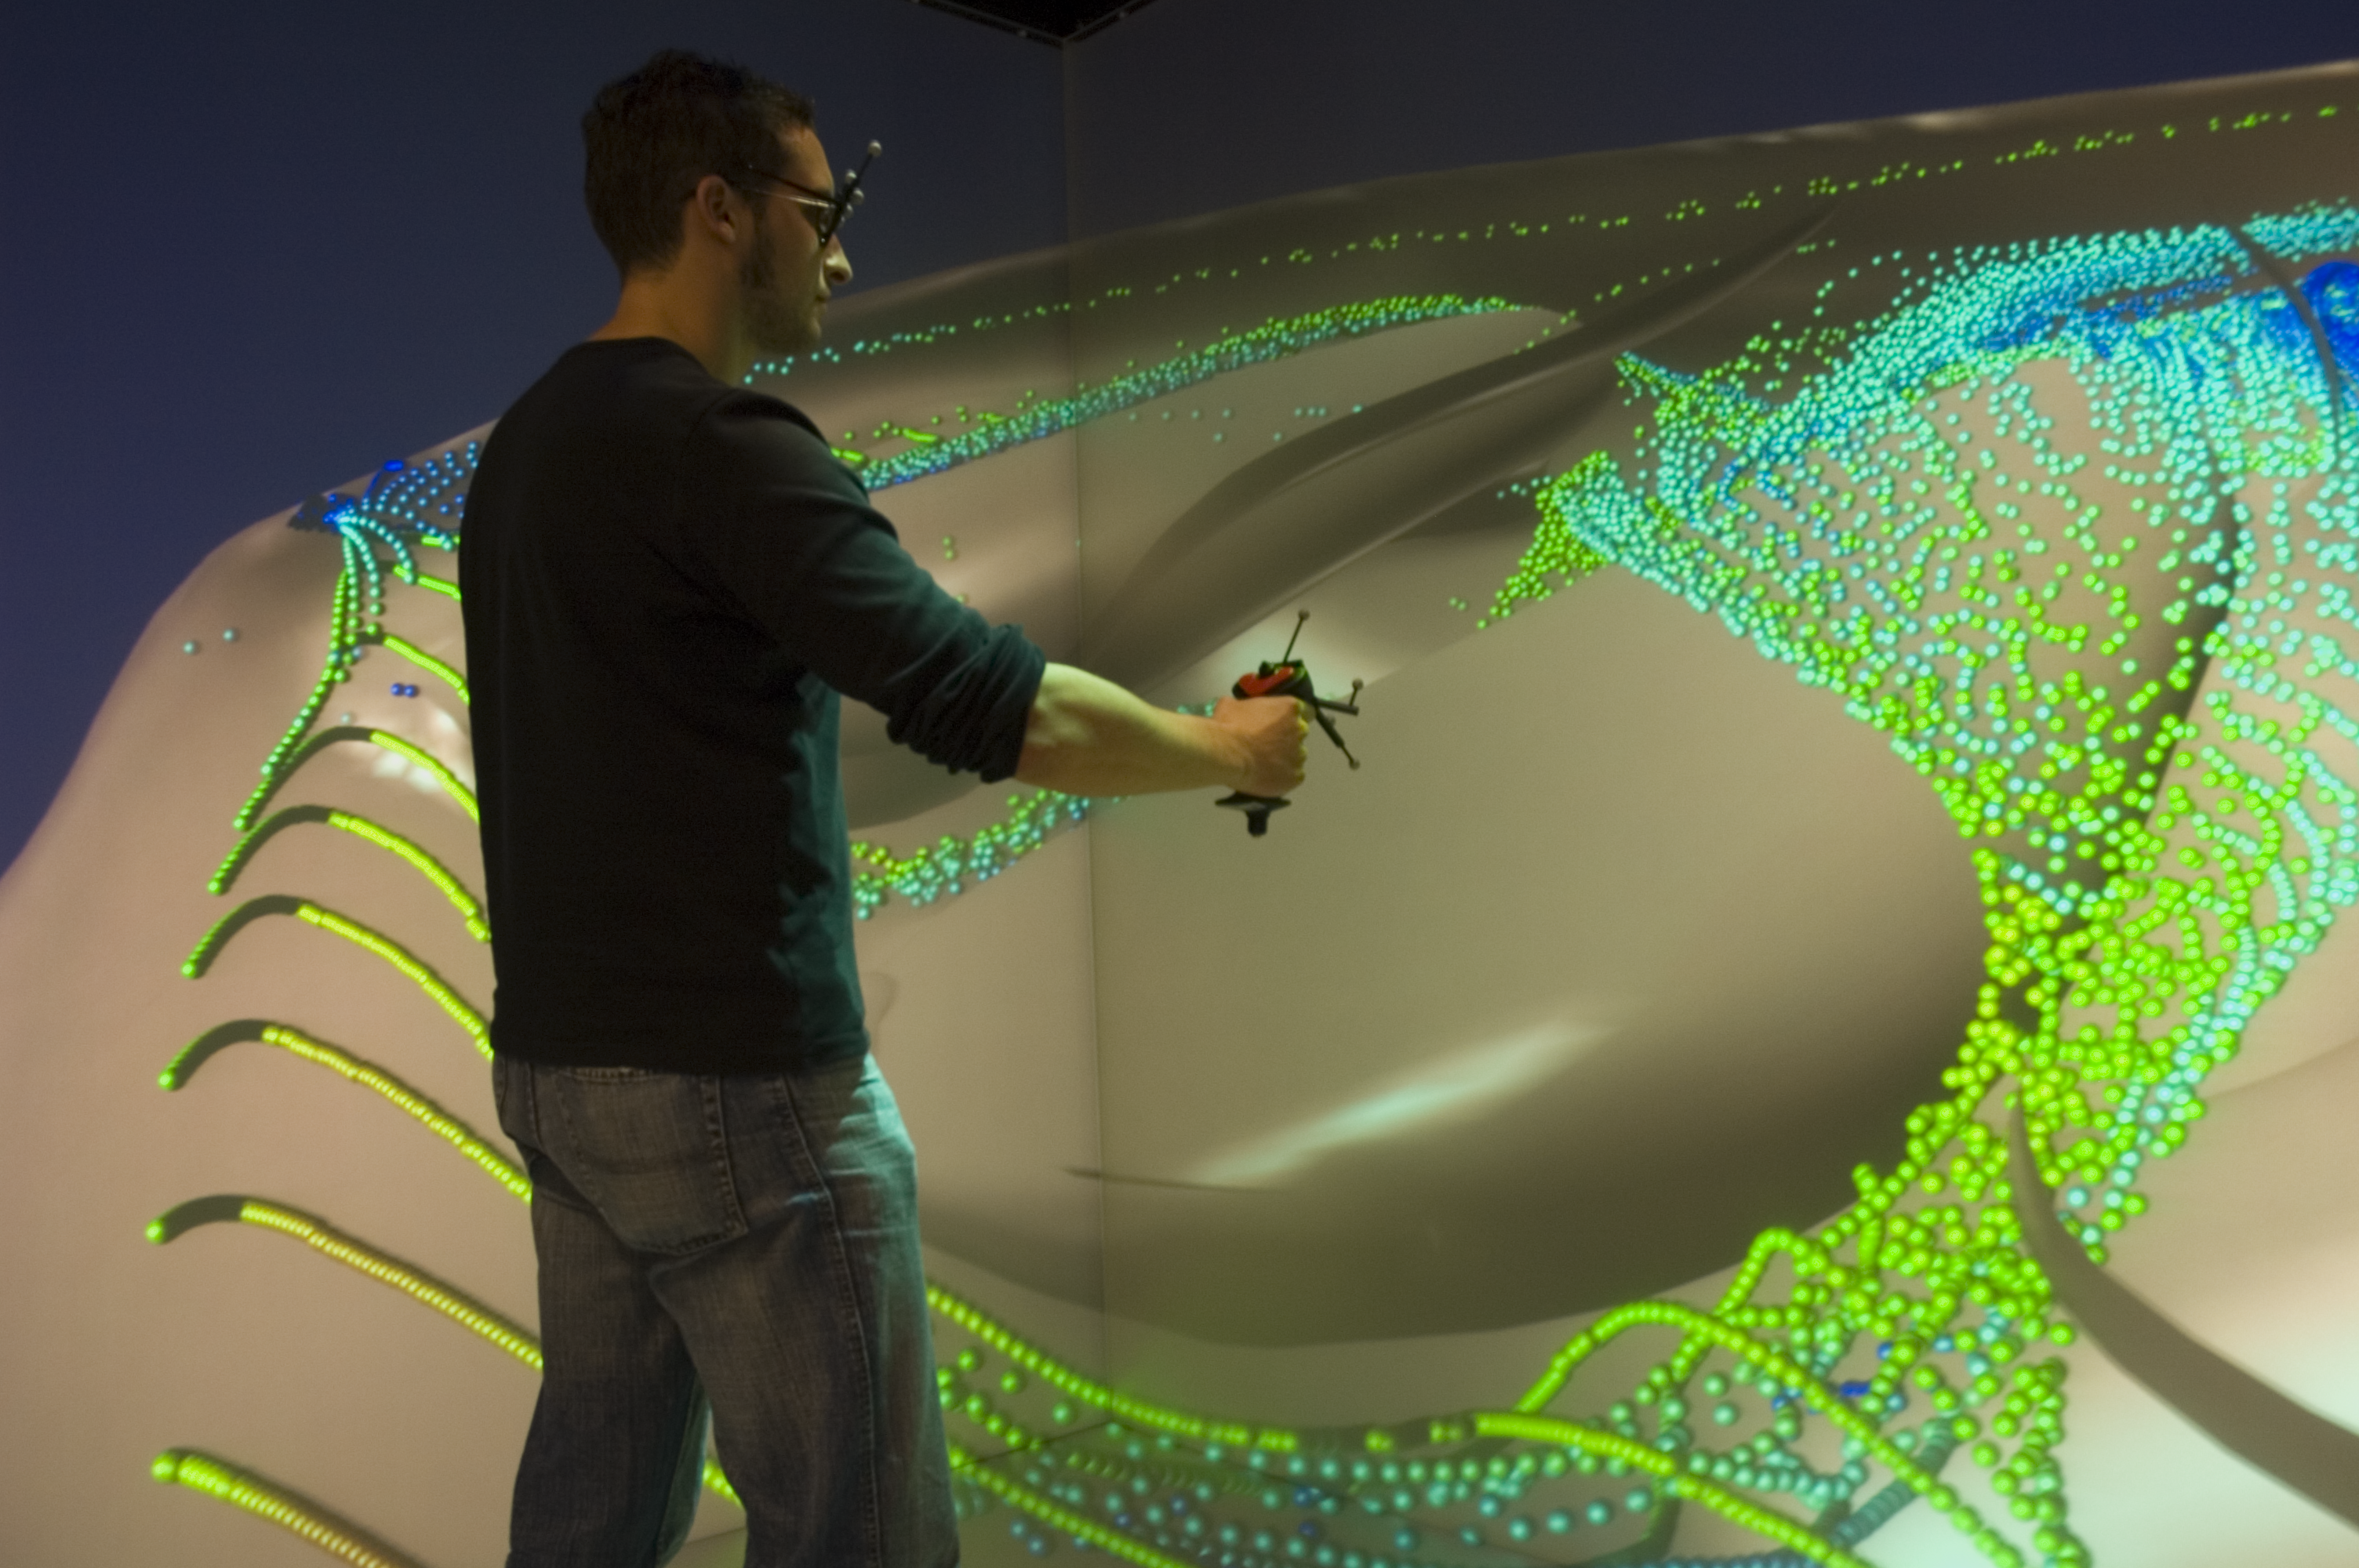
Creative and artistic design processes are reflexive processes, where internal product images are transformed into external representations and prototypes. During this process, physical models play an important role due to their three dimensionality and materiality. Such models can be perceived haptically and allow for a natural way to judge their spatial properties. Moreover, using plastic materials as clay they can be manipulated intuitively. Nevertheless, physical models have several disadvantages, i.e., high material costs, inaccuracies, and potentially a deficient scale. These problems are resolved by digital tools such as Computer-Aided Design (CAD). These, however, come at the cost of losing the described beneficial qualities of the physical models, so that, both approaches are diametrically opposed. Therefore, creative processes usually incorporate both and there is an ongoing alternation between them in different work steps. Nonetheless, there is a hard transition between the physical and digital work steps. First of all, the transformation between physical and digital models tends to be quite effortful, but, furthermore, the properties of the physical and the digital modeling itself are as mentioned very different and create a gap in the work- and creative flow.
In this project, we explore how methods from VR can be used to develop new design tools which strike a balance between the properties of both approaches and create a link between the digital and physical steps in the design processes. By using haptic in/output devices and immersive display systems, the developed tool shall allow for a spatial, embodied, and haptic manipulation of virtual shapes. Thereby, we aim at increasing the intuitiveness of designing and sculpting with digital tools. Additionally, we want to explore how such a VR-based tool can be used to augment and support existing design processes and gain new insights into the influence of new digital media in creative processes.
 |
 |
 |
| An artist sculpting a tomato using clay (left), a haptic device combined with a semi-immersive display system (middle), and a virtual sculpting tool prototype (right). | ||
Back to project list - Back to top
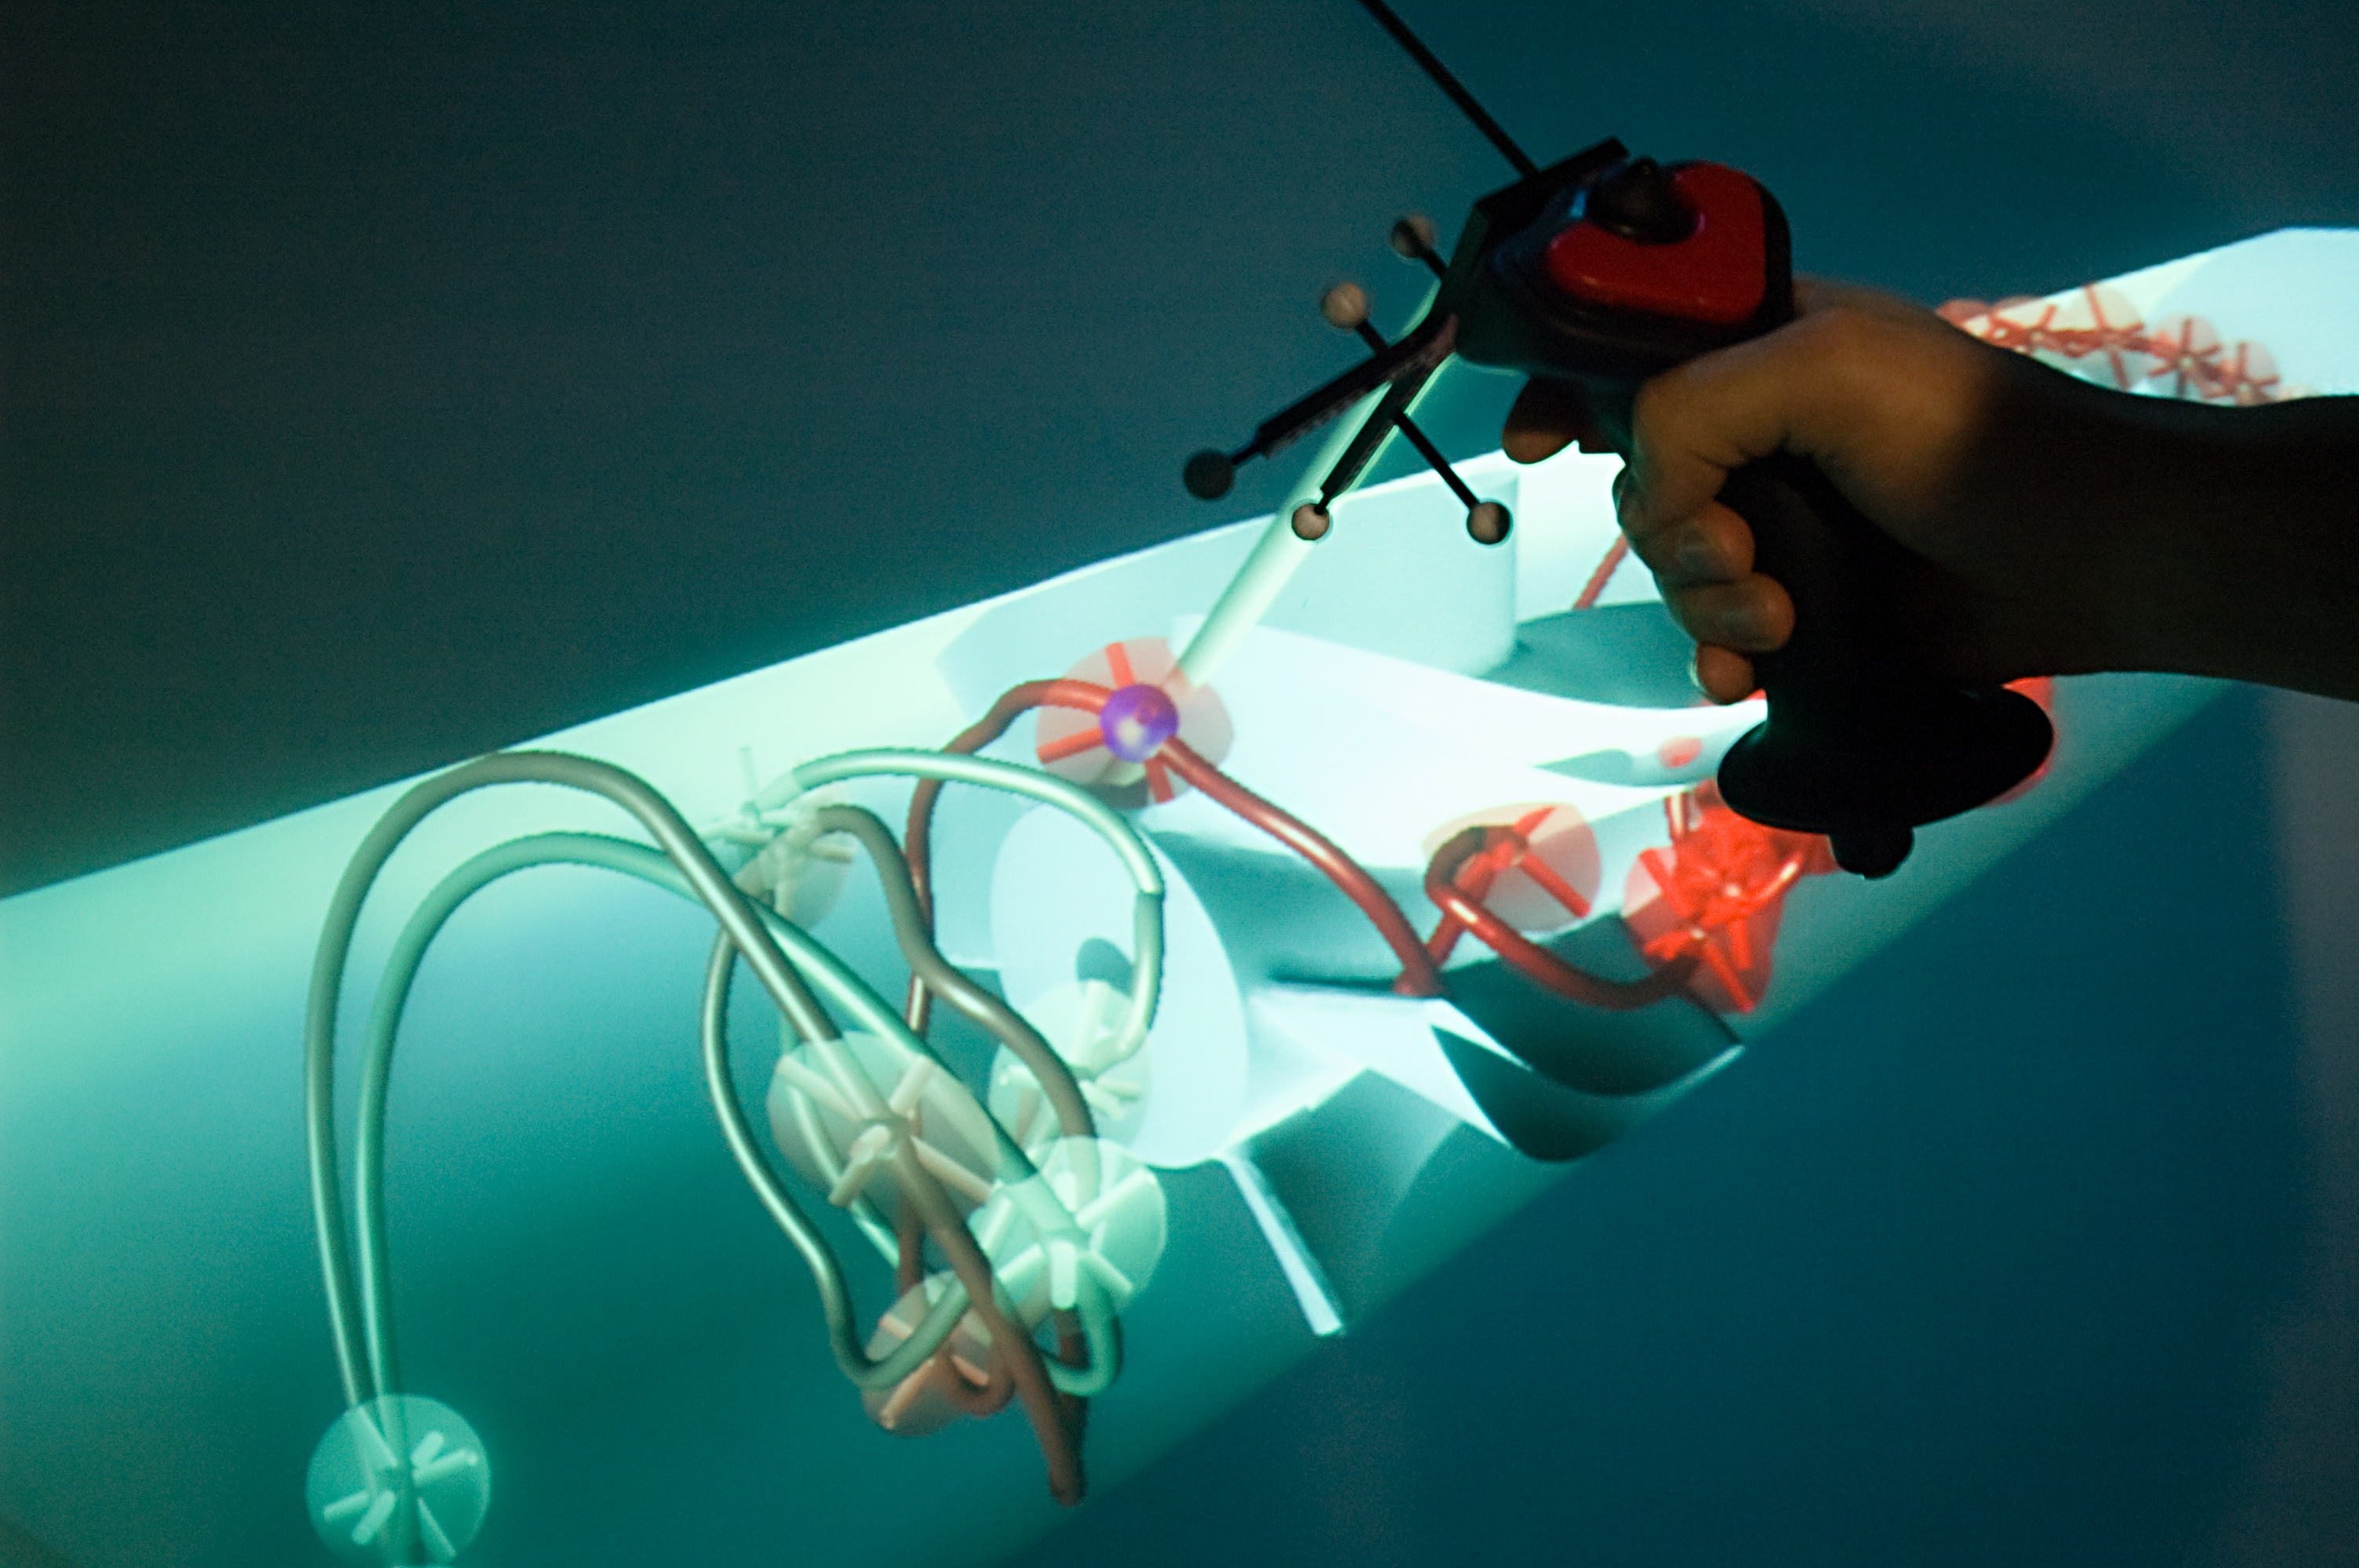
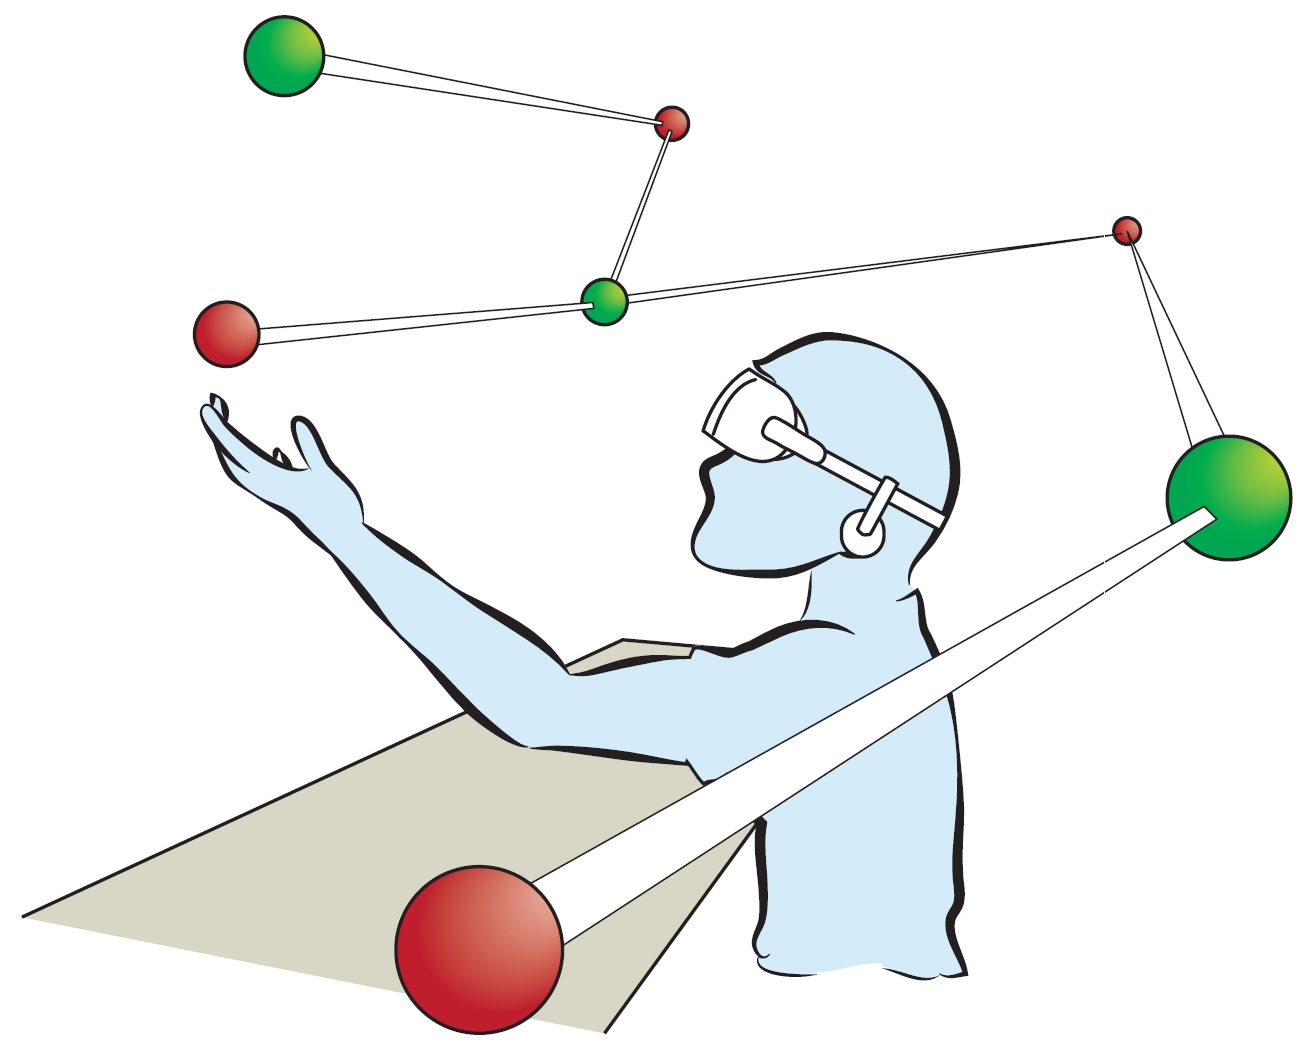
In this European project, experts from computer sciences and anesthesiology are working together on two innovative tools that allow medical doctors to perform safer regional anesthesia. The first tool is a virtual reality-based simulator enabling a trainee to perform a regional anesthesia on a virtual patient. To this end, the partners develop and integrate methods in the areas of soft-tissue modeling, tool-tissue interaction, haptic rendering, and ultrasound simulation to create a complex unified simulation. The second tool is a complementary system that provides an anesthesiologist with additional information during a procedure. Here, ultrasound images gathered in the operation theater are processed in real-time to give hints to the performing doctor on anatomical structures that are difficult to identify with ultrasound. Both tools rely on an anatomical patient database and methods to create new models adapted to specific patient characteristics.
The resulting prototypes are tested and tuned together with experts in the medical procedure. Furthermore, two studies will be performed during the next year to show the capabilities of the developed tools in a combination with a realistic teaching curriculum and in the real operation theaters. The studies will be carried out in three different hospitals spread over Europe.
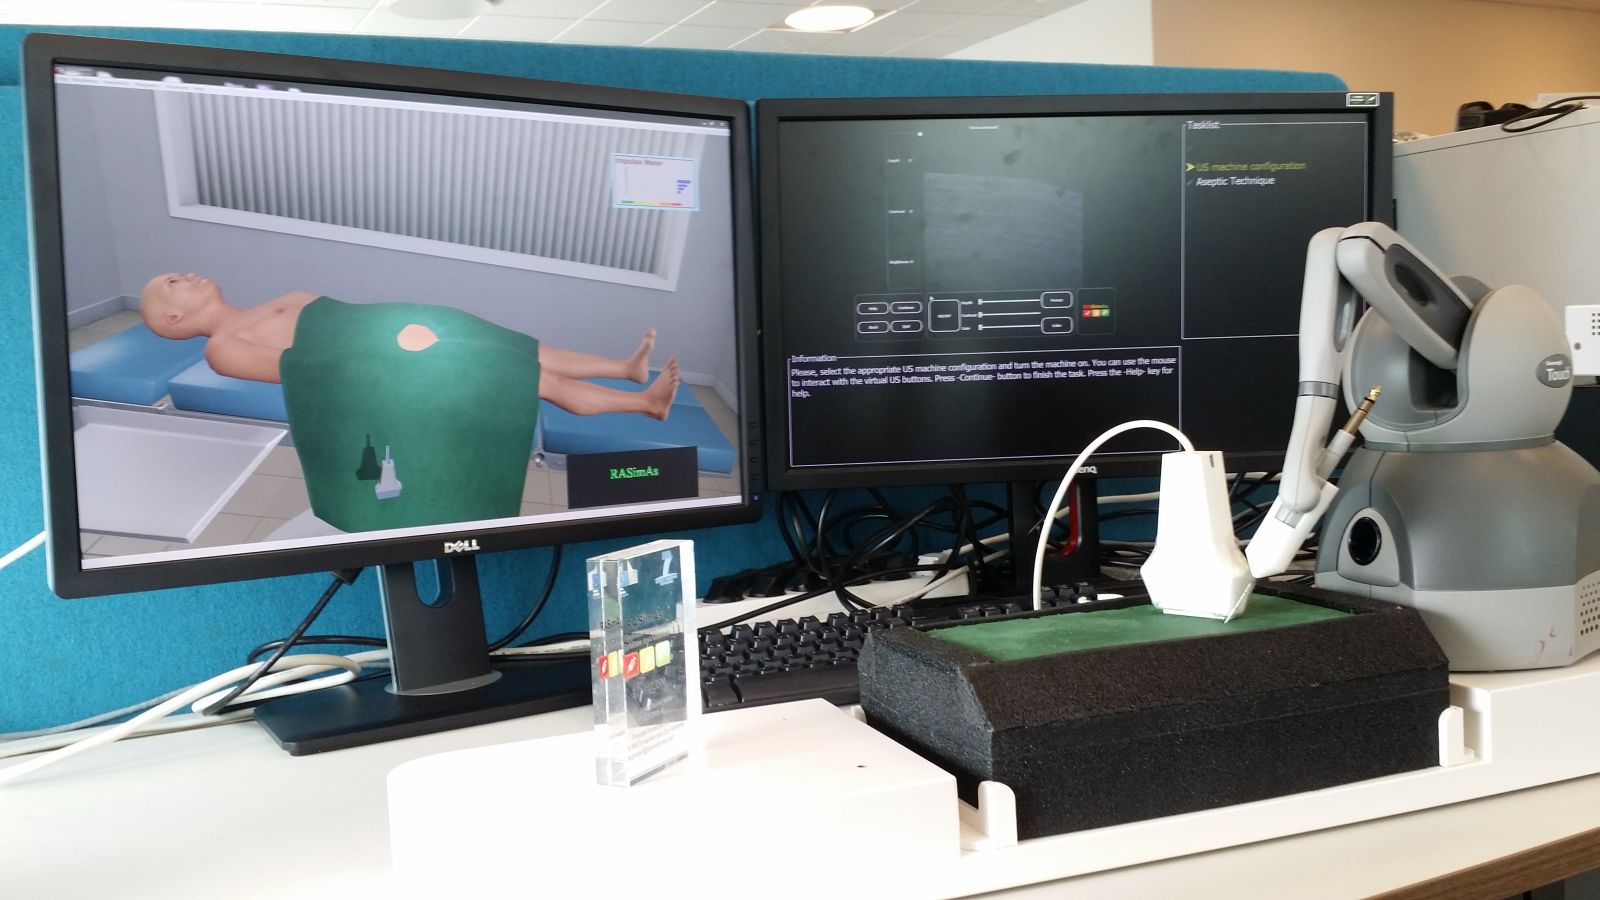 |
| Simulator prototype. The left screen shows the patient view, while the ultrasound image is displayed on the right. A haptic device is used to control the needle; additional passive haptic feedback and support for the probe is provided with foam. |
Back to project list - Back to top
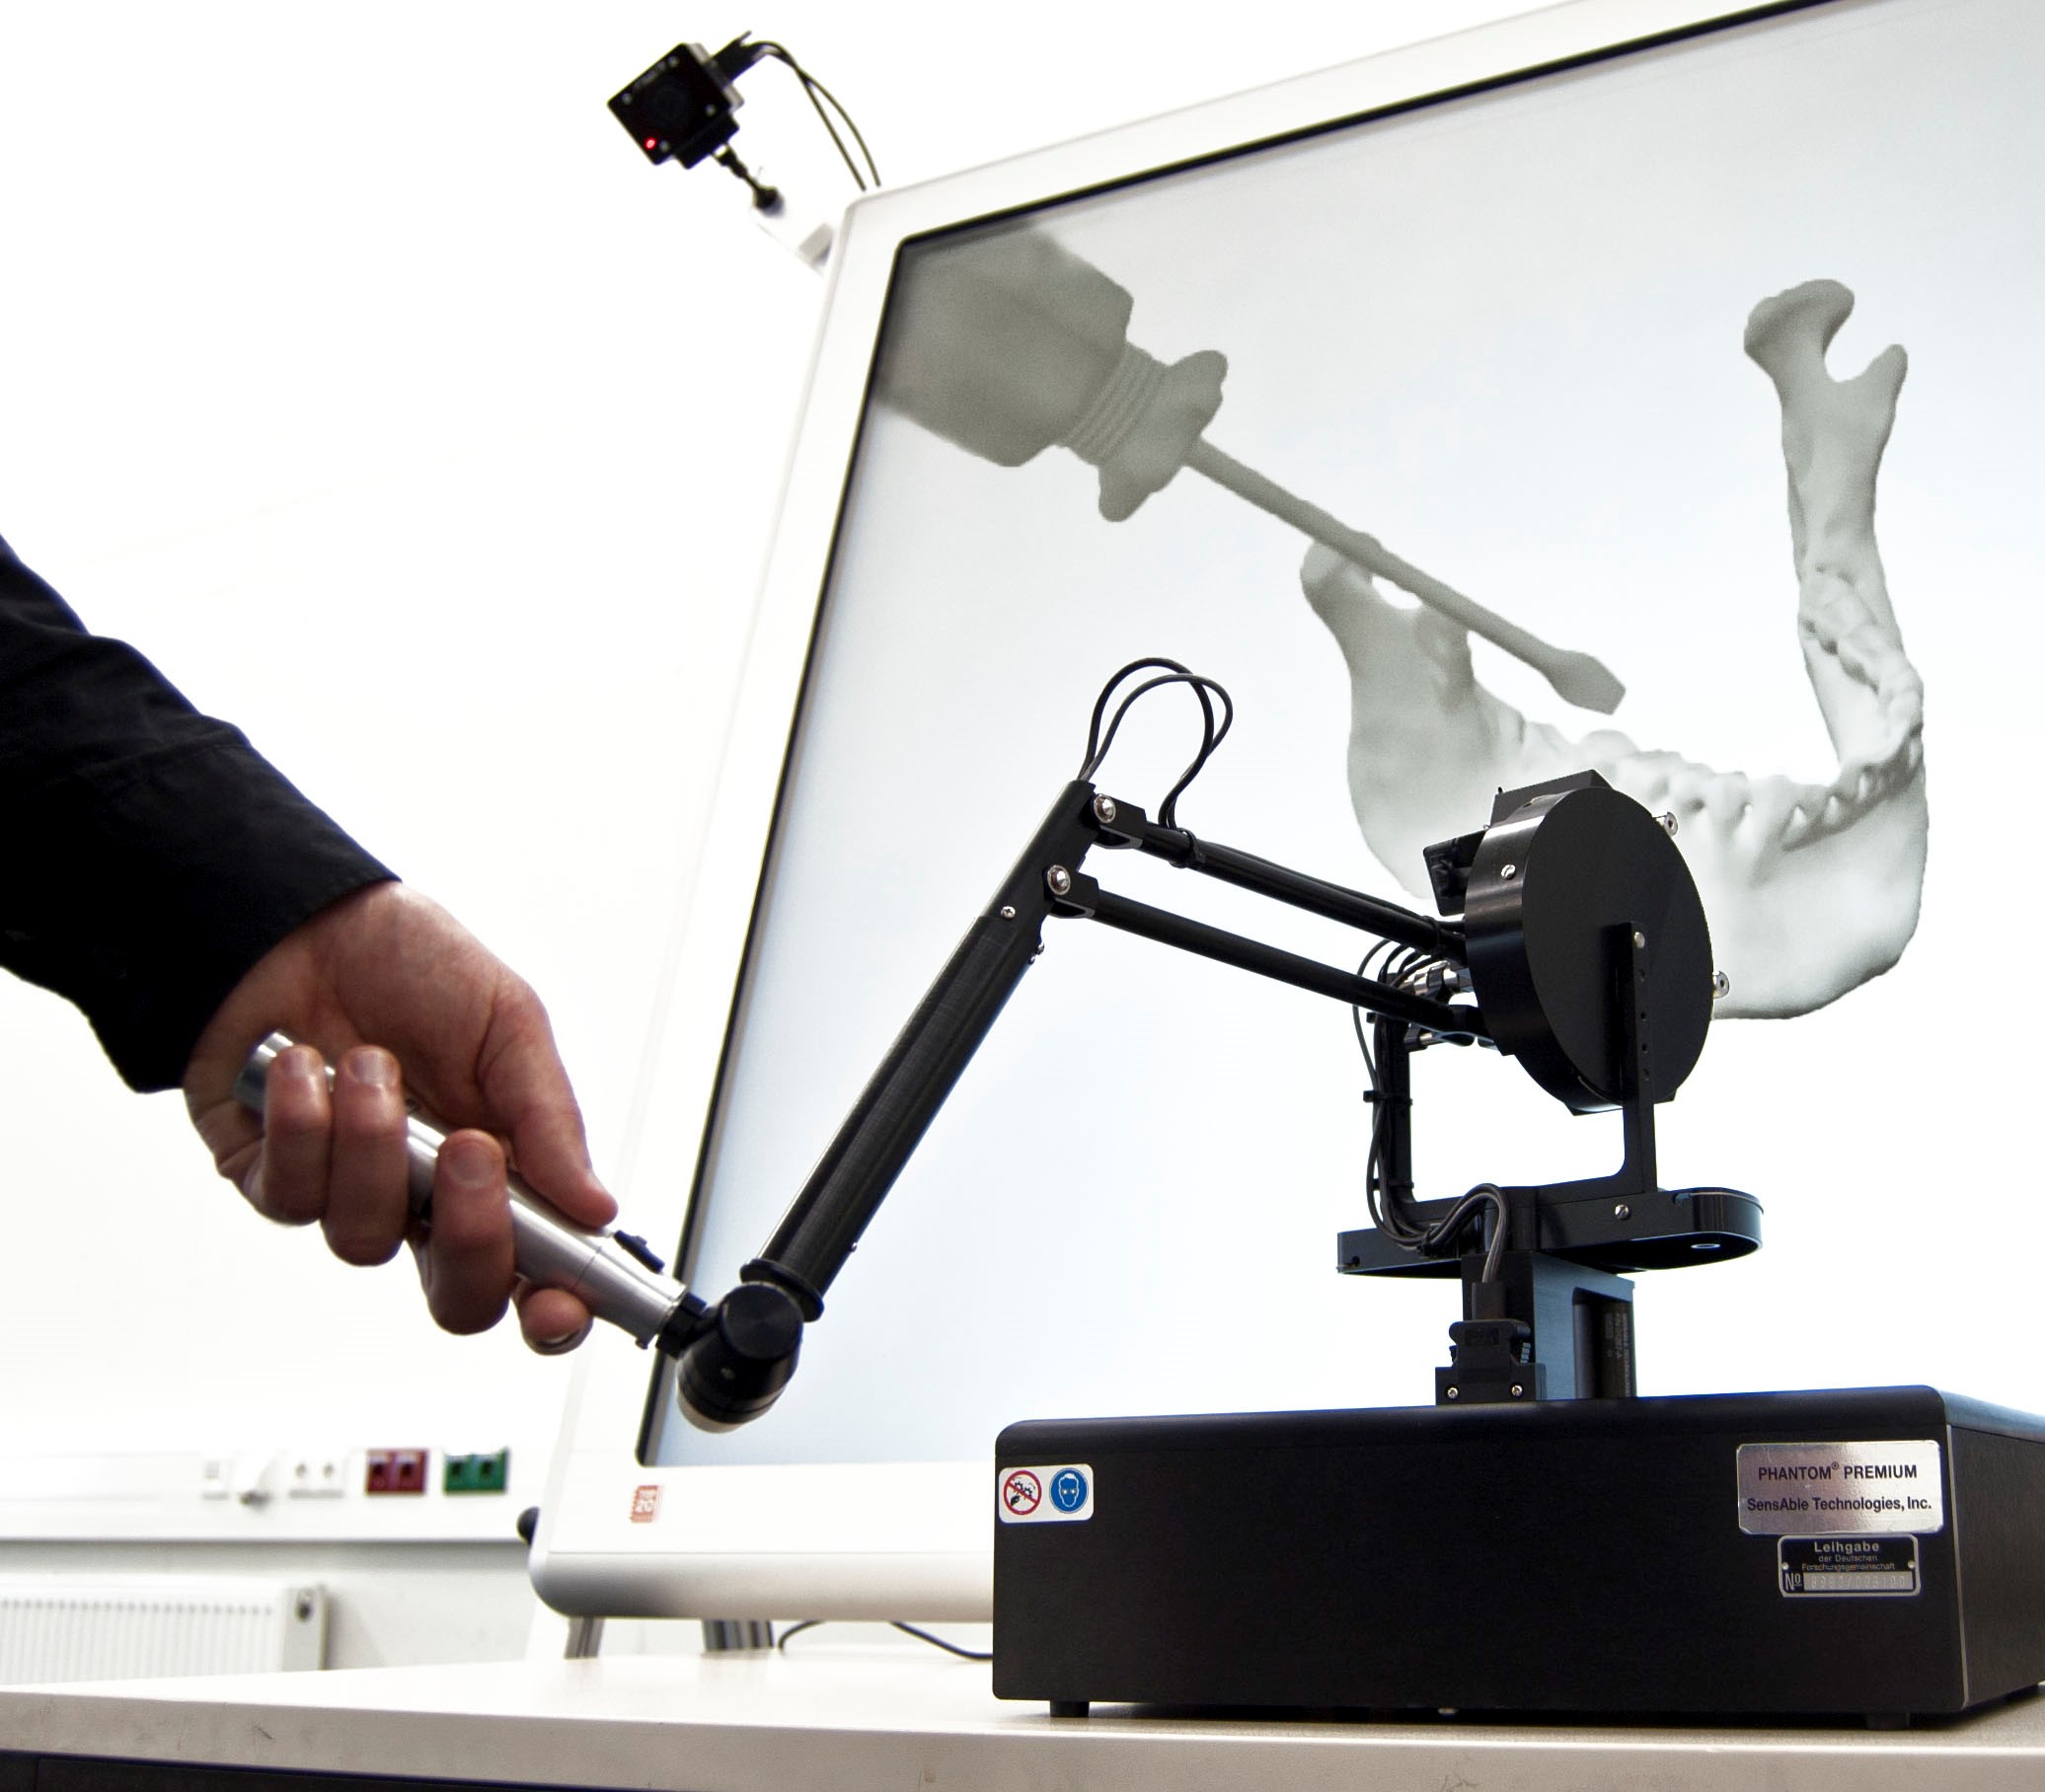
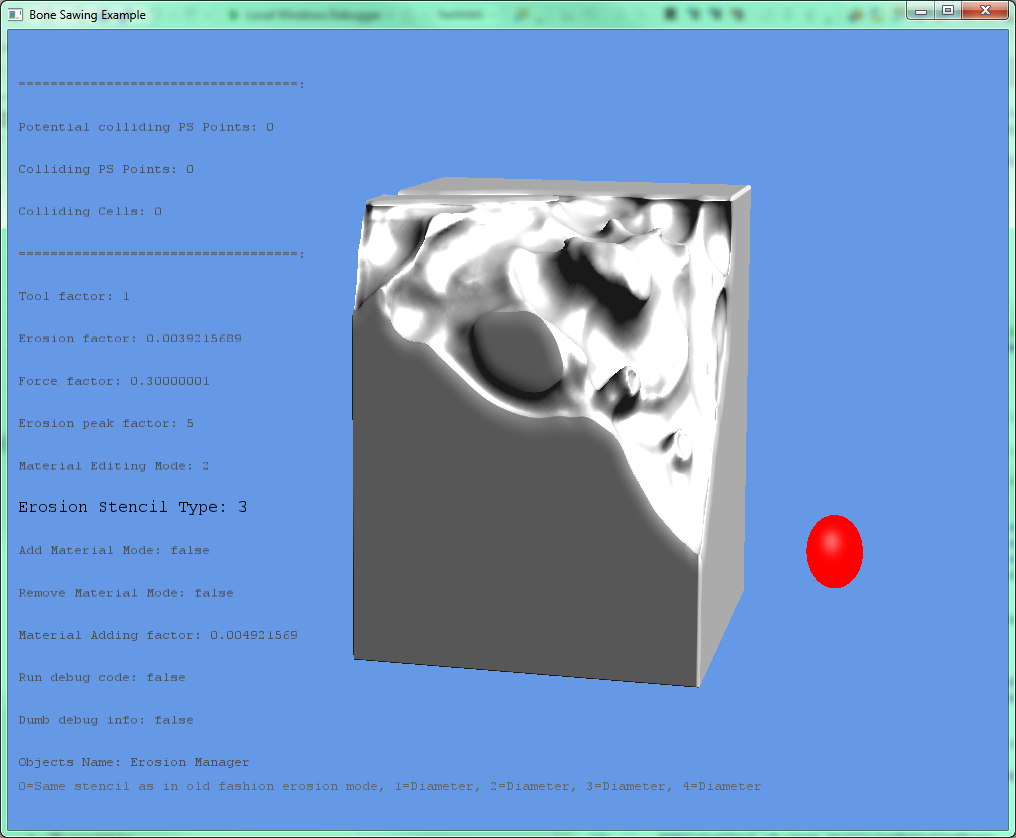
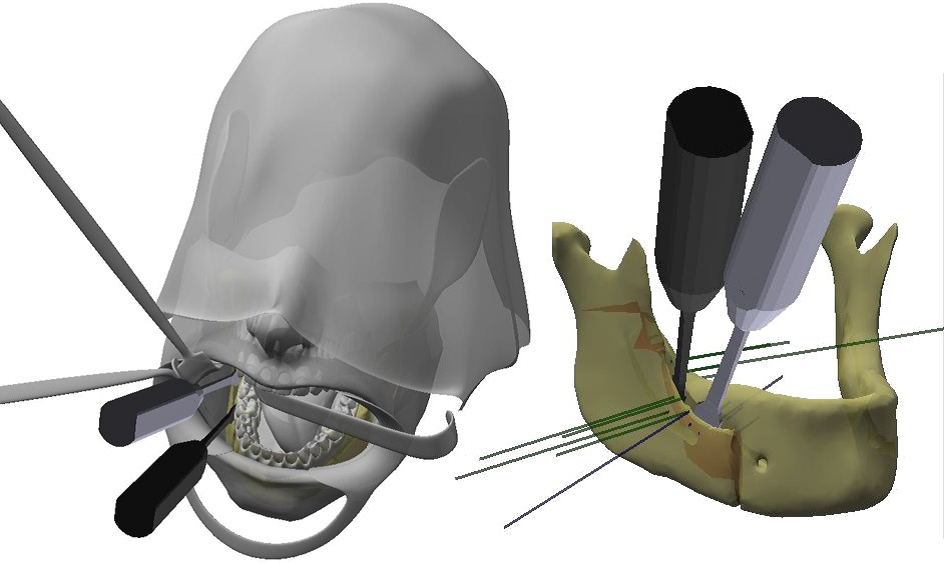
This project aims at developing a specialized training system dedicated to the teaching of a major maxillofacial surgery procedure based on Virtual Reality technology. The medical procedure of interest, the bilateral sagittal split osteotomy (BSSO), allows the displacement of the lower jaw in all three spatial dimensions, e.g., to correct an under- or overbid. The procedure is performed via an intraoral approach and includes the creation of an osteotomy line in the mandible using a saw or a burr, followed by a controlled splitting of the bone by a reversed twisting of one or two chisels inserted into the line.
To enable a realistic and efficient simulation of the breaking bone in real-time, the extended finite element method is employed as it allows the effective modeling of deformations and induced structural changes. Furthermore, as one important aspect of the simulator is training specific motor abilities for the split osteotomy, one prerequisite to the system is a reproduction of the real interaction with a high degree of realism. Therefore, the simulator utilizes multi-modal human-machine interfaces, i.e., haptic devices allowing a trainee to control virtual surgical instruments intuitively and provide him with force feedback. To enable a stable and responsive haptic interaction, the scene would need to be simulated at a haptic update rate, which is usually considered to be around 1000 Hz. Nevertheless, some components of the simulation are very complex, i.e., simulating the bone with an adequate mesh resolution results in a much slower simulation rate. To resolve this conflict, a multirate simulation approach is applied where multiple simulation components work together but utilize different representations of the simulated scene objects, use models of their physical behavior with different complexity, and run at different update rates. As foundation for this physics simulation experimentally determined material parameters are used together with anatomical models extracted from cone beam CT-Scans.
 |
| Human Subject performing the real-effort sorting task in the aixCAVE (left) and preparations for a humanoid avatar fulfilling the same task (right). |
Back to project list - Back to top
| funding | EU project |
| contact person | Marcel Krüger |
The Human Brain Project (HBP) started in October 2013 and is currently in its third and last phase under the special grant agreement 3 (SGA3). The long-term goal of the project is to create infrastructure and tools to support the neuroscientific research of the human brain. This includes the development of neuronal network simulators and their deployment in compute centers around Europe. These compute resources enable exascale simulations of complex biological networks.
The Virtual Reality Group at RWTH Aachen University works together with the University of Trier as well as the Universidad Rey Juan Carlos and the Universidad Politénica in Madrid on the task regarding the visualization of such simulations. The Virtual Reality Group in particular works on a pipeline that is able to extract live data out of running simulations to support in-transit visualization by connecting to established visualization frameworks. Ongoing development on integrating steering capabilities to the pipeline enables users to alter running simulations up to the exascale level to create new and improved workflows for neuroscientists.
 |
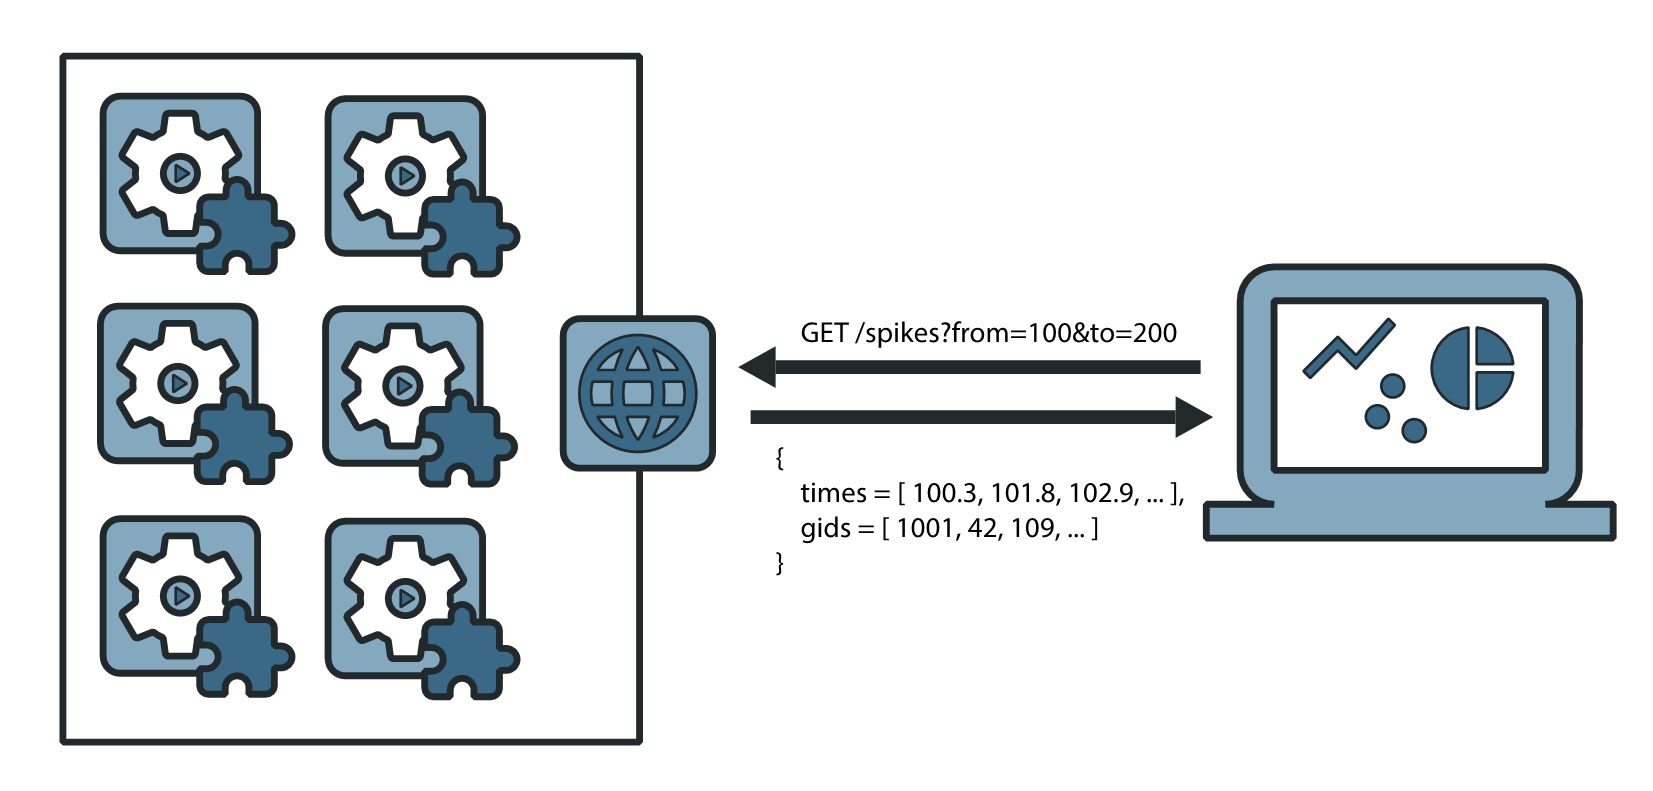 |
| The official HBP logo (left) and a sketch of Insite, our generalized pipeline for in-situ visualization of neural network simulations (right). | |
Back to project list - Back to top
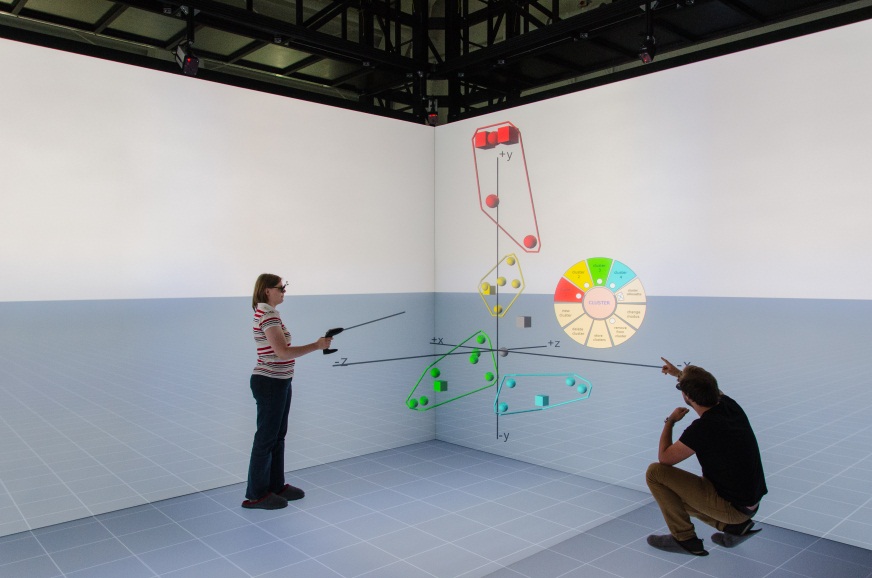
The Virtual Reality Group participated in an interdisciplinary project kindly funded by the IMP, investigating the advantage of using a distortion-free view on a three-dimensional data representation in Correspondence Analysis (CA).
CA is used to interpret correlations between categorical variables in the areas of social science and market research. To do so, coherences of variables are converted to a three-dimensional point cloud and typically plotted as several different 2D-mappings, each containing two axes. The major challenge is to correctly interpret these plottings. But, due to a missing axis, distances can easily be under- or overestimated. This can lead to a misinterpretation and thus a misclustering of data. Hence, an improvement is needed.
The aim of CAVIR, our approach for CA in Virtual Reality, is to accelerate the process of interpreting and clustering CA point clouds and thereby reduce the potential cluster errors mentioned above. Users are able to make better decisions, due to a better and not misleading view onto the three-dimensional representation of the point cloud and different options to show additional information, to measure Euclidean distances, and to cluster points. Besides, our approach is available for two different display system classes as shown in the figure. On the one hand, we use our aixCAVE to enable a collaboration with several people and on the other hand, we provide a semi-immersive low-cost desktop system as quick possibility to cluster points in the office in order to embed its use into the normal workflow.
 |
 |
| Collaborative analysis of a CA point cloud in the RWTH aixCAVE (left) and a single-user analysis at a semi-immersive desktop system (right). | |
Back to project list - Back to top
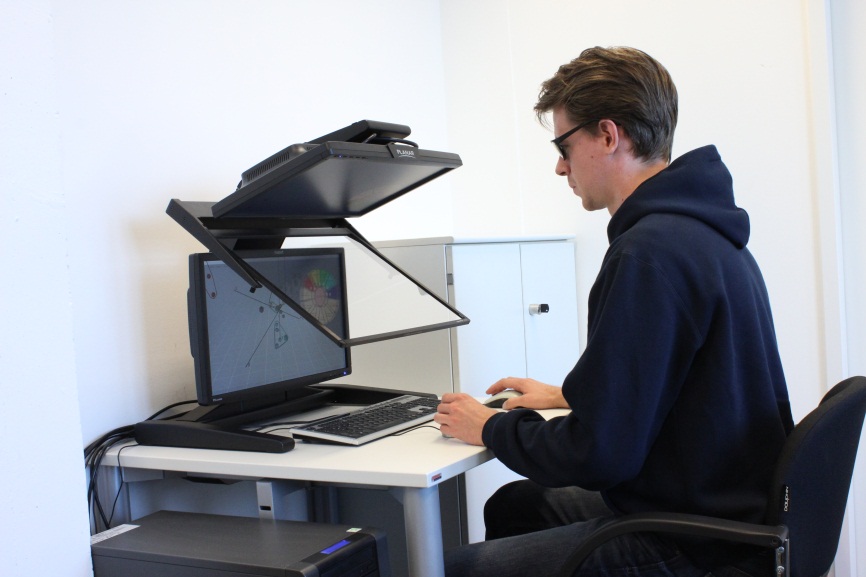
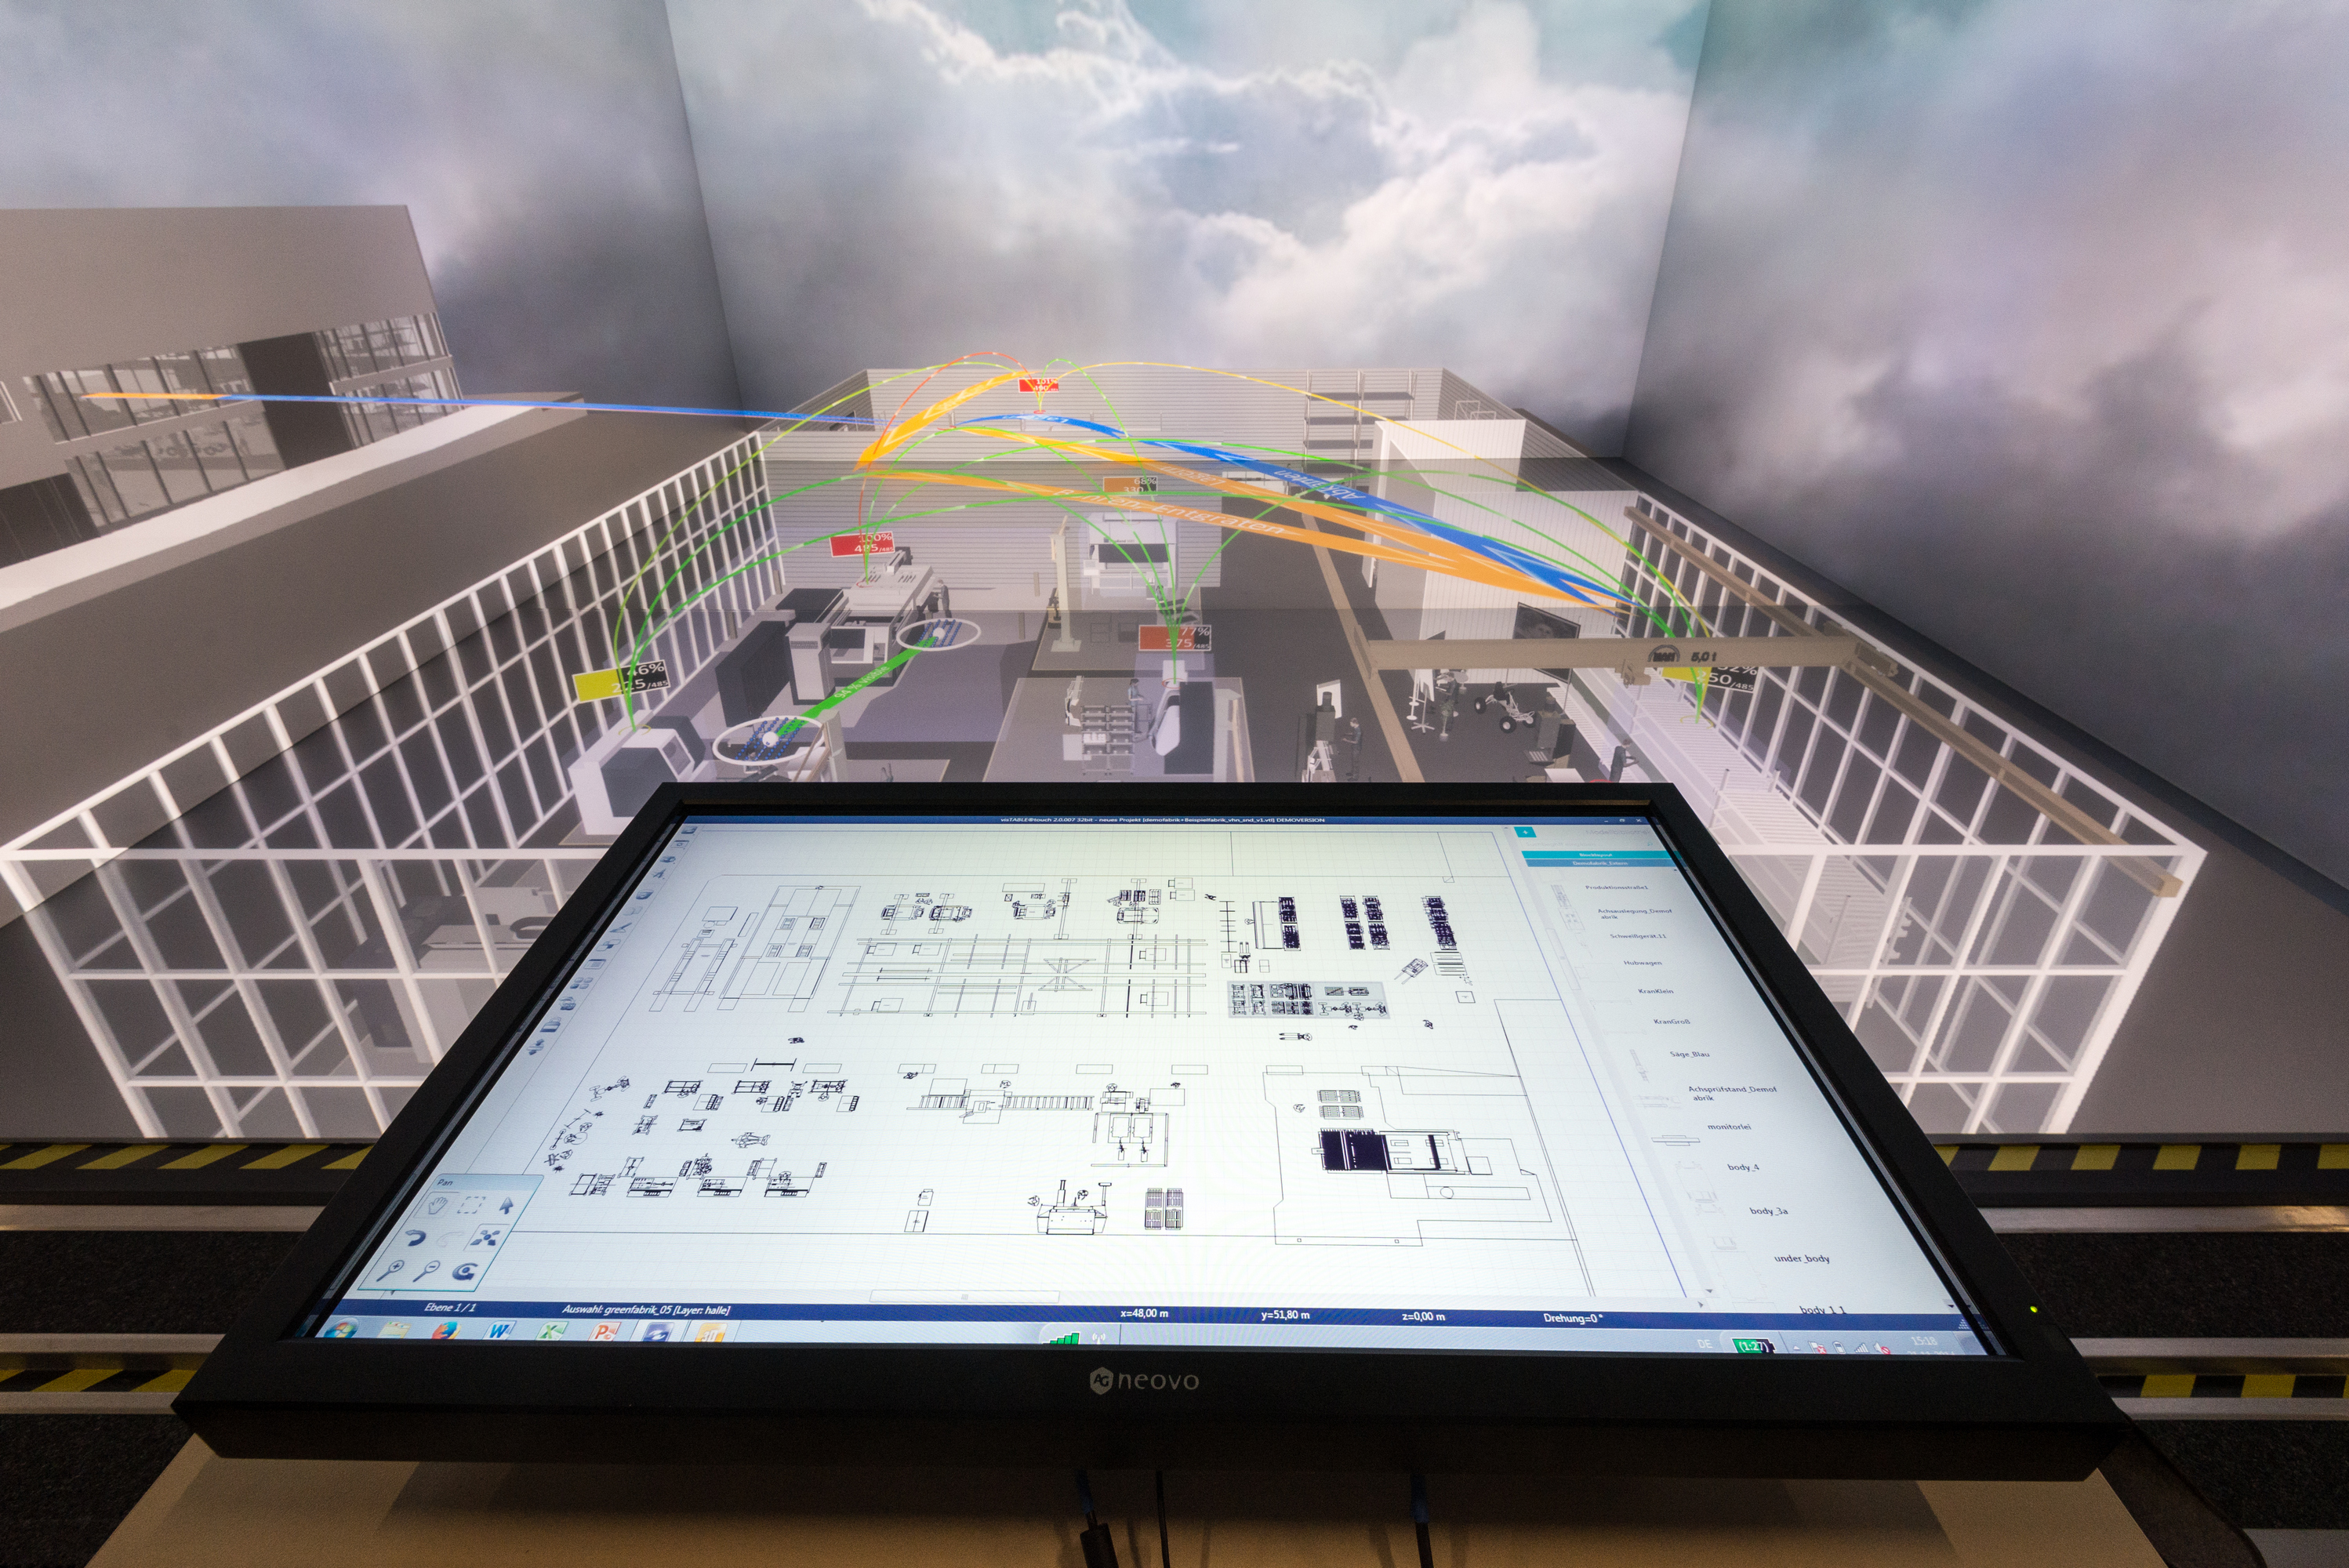
In one of two VR projects within the Cluster of Excellence: Integrative Production Technology for High-Wage Countries, we are developing the Virtual Reality (VR) application flapAssist, which aims at improving the factory layout planning process. As its sibling project Hyperslice Visualization of Metamodels for Manufacturing Processes, this project is being developed as a component of the Virtual Production Intelligence (VPI), which is a holistic and integrative concept for the support of collaborative planning, monitoring, and control of core processes within production and product development in various application fields. The main goal is the development of an immersive virtual reality solution that integrates well with established factory layout planning processes. This solution will offer important means for layout analysis, like virtual walkthroughs, information visualization, and annotation support, from within one application, thereby offering advantages over existing solutions.
To integrate flapAssist with established layout planning workflows, a plugin that connects flapAssist with the factory planning tool visTABLE®touch via a network connection has been developed. As a result, changes made using visTABLE®touch can be reviewed on-the-fly in the virtual environment by means of virtual walkthroughs. To allow users to efficiently traverse the factory model, appropriate navigation techniques are provided. Furthermore, flapAssist provides visualizations for planning-relevant data, like material flows or workplace visibility. One research focus is the development of new metrics and suitable visualizations that assist planners in evaluating factory layouts. One major challenge in this context is the design of interaction techniques that allow users to access and configure the available functionalities efficiently. Another research focus lies on data annotation techniques that offer possibilities to persistently capture comments and design decisions during walkthroughs. So far, users are able to create several different types of annotations, like labeled screenshots, sketches, or audio comments using different interaction techniques. A web-service-based persistence implementation enables the storage of annotation data directly within the VPI. An important goal is to ensure the availability of all of flapAssist’s functions on additional platforms, like desktop systems, as this facilitates integration into established workflows.
 |
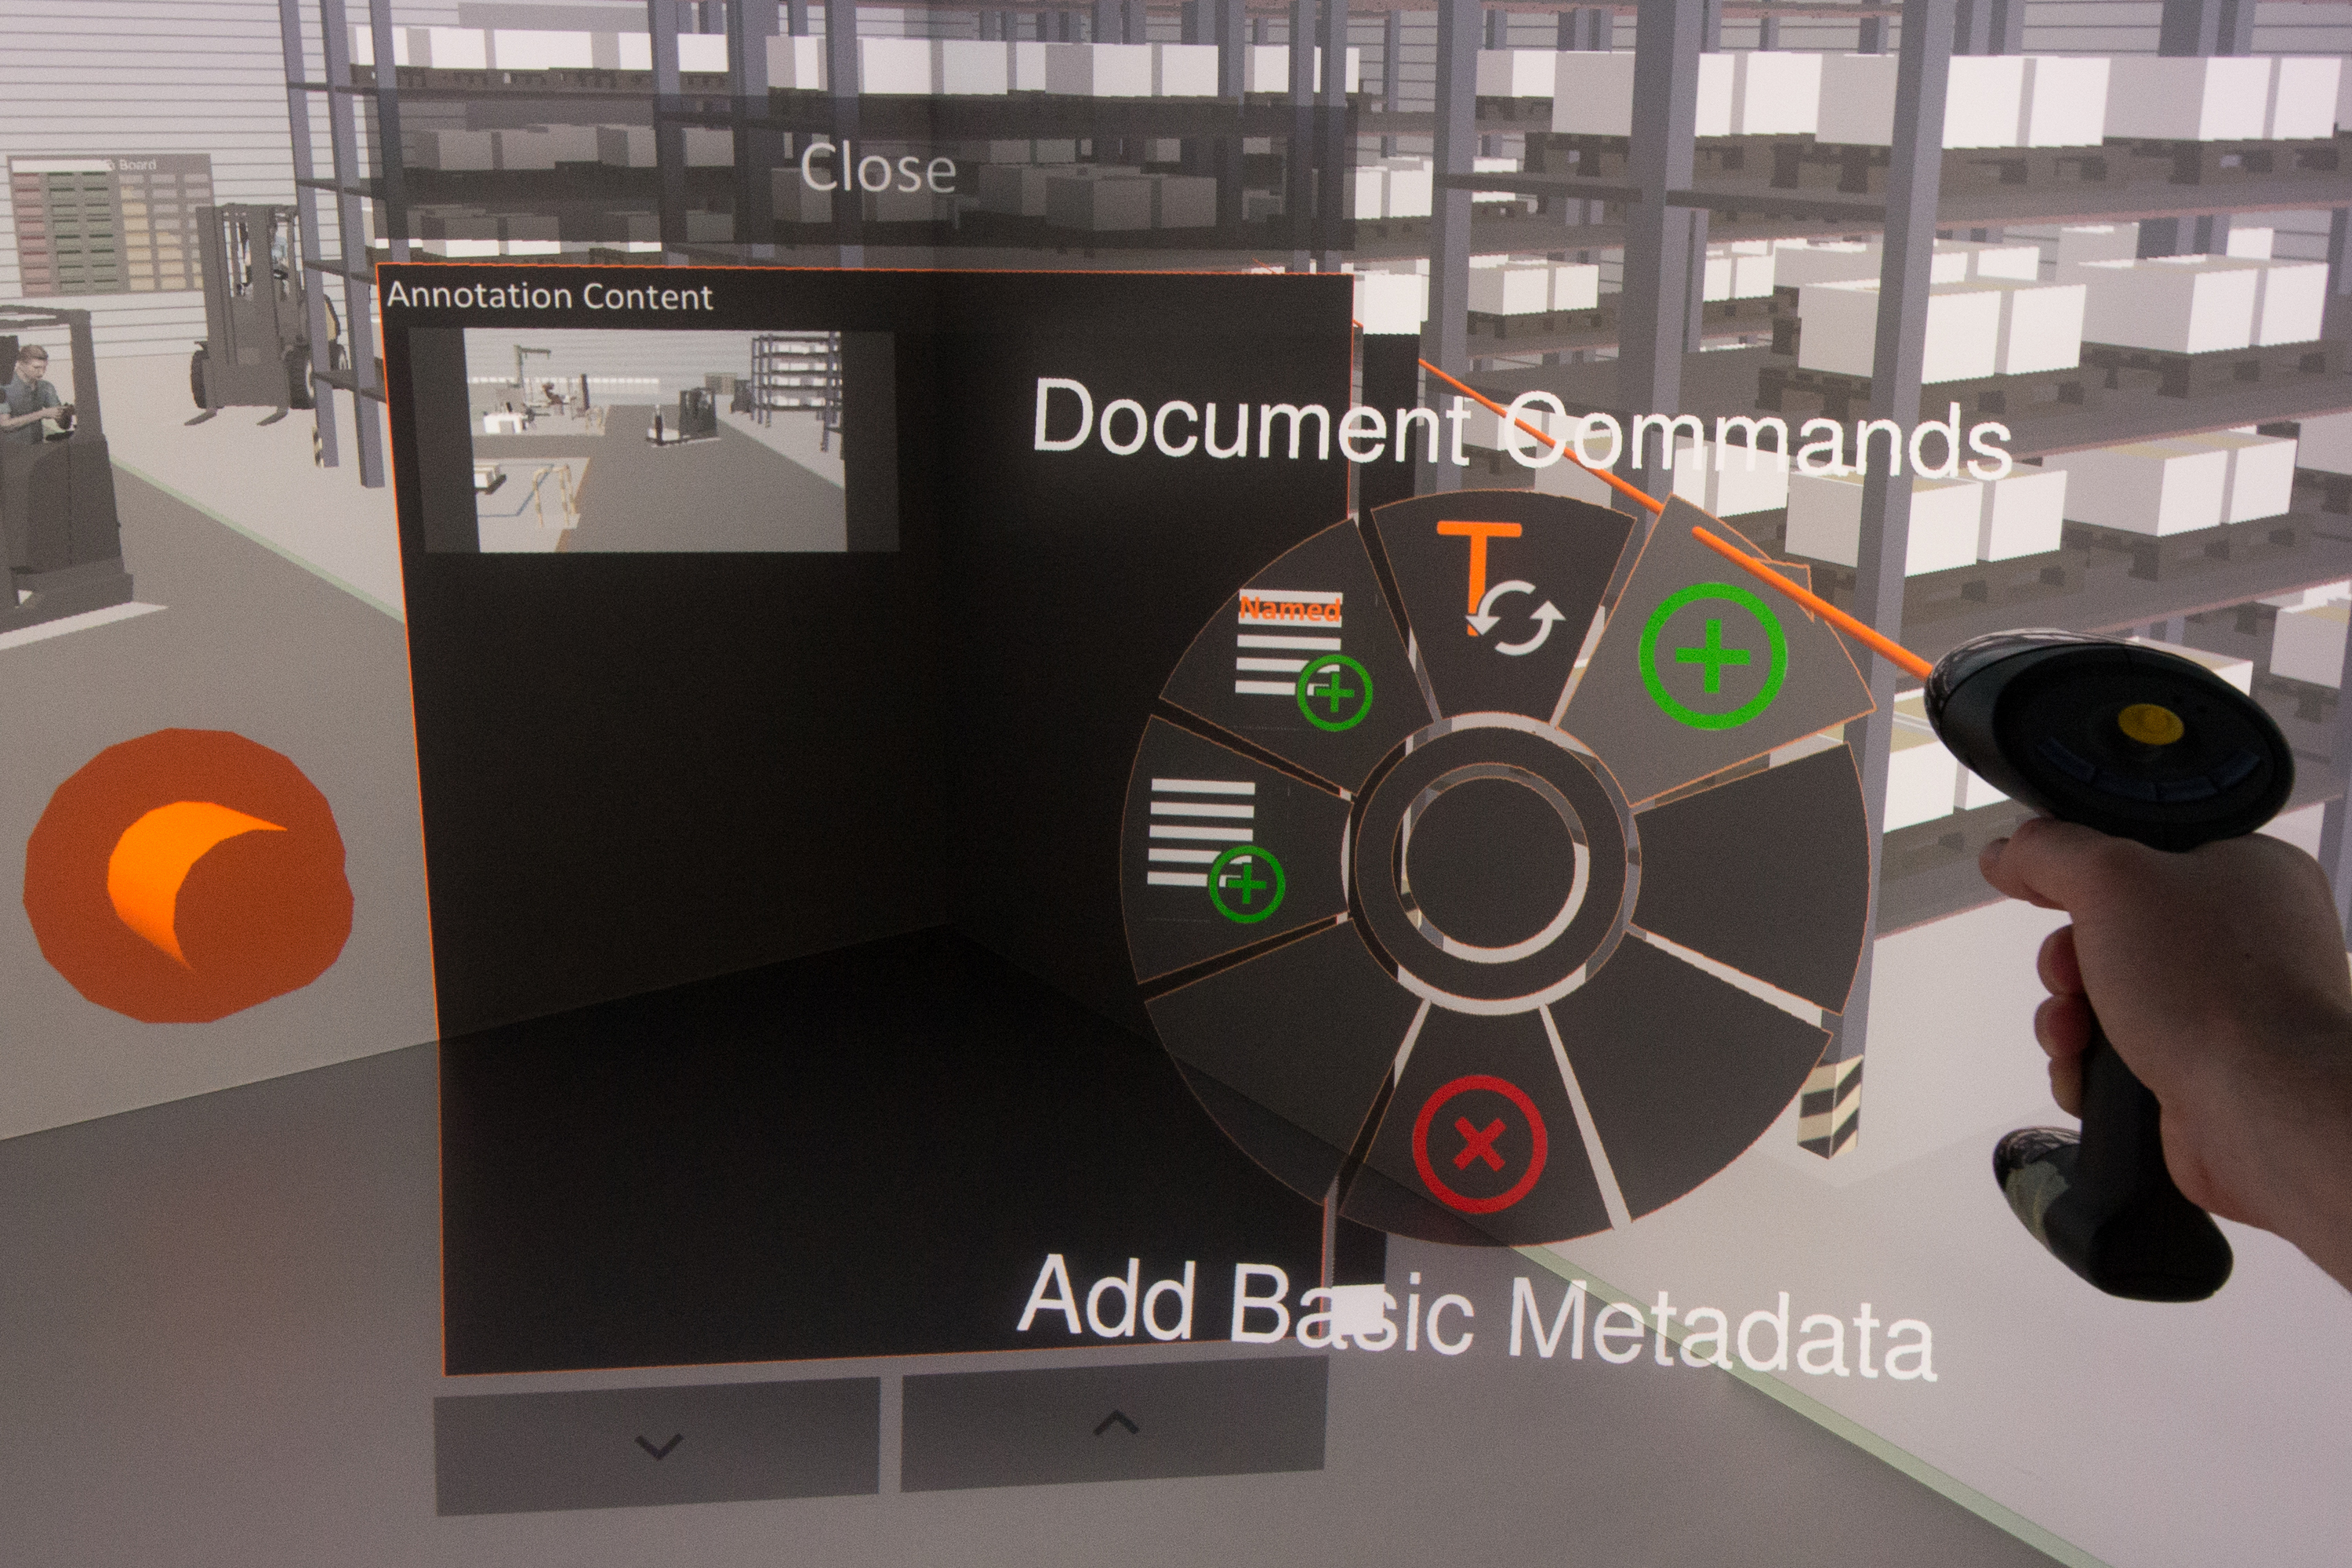 |
| flapAssist allows for performing on-the-fly layout reviews and facilitates decision making via visualizations (left). Annotations let planners capture comments and decisions (right). | |
Back to project list - Back to top
| funding | internal |
| contact person | Ali C. Demiralp |
3D-Polarized Light Imaging (3D-PLI) is a recent neuroimaging technique enabling the study of structural connectivity of human and animal brains at unprecedented resolutions, reaching up to 1.3 micrometers within the sectioning plane. This method is applied to serial microtome sections of entire brains, and exploits the birefringent properties of the myelin sheaths surrounding axons.
Our contribution is a distributed, data-parallel particle advection pipeline to conduct large-scale streamline tractography analyses on 3D-PLI vector fields. This enables visualization of long-range fiber tracts within the brain at previously unavailable resolutions. We further support computation of attracting and repelling Finite-Time Lyapunov Exponent (FTLE) fields in brain data, which yield more stable results than traditional topological approaches, revealing insight on the behavior of fiber pathways and physical structure.
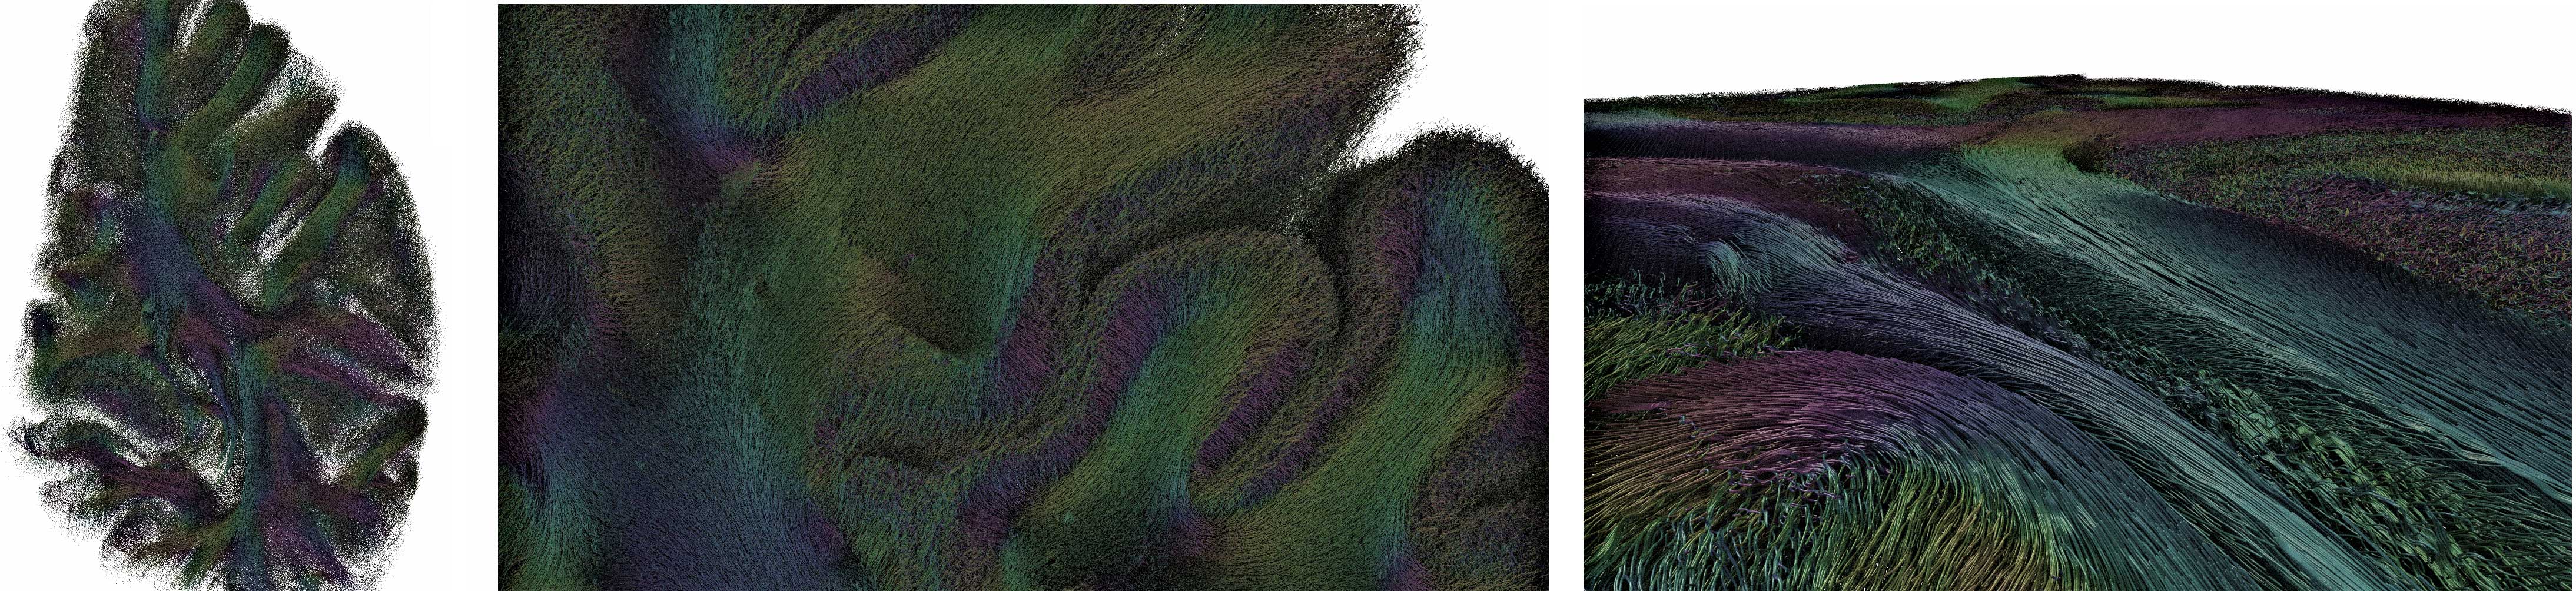 |
| Streamlines extracted from a partial human dataset. |
Back to project list - Back to top
In the second phase of the “Cluster of Excellence: Integrative Production Technology for High-Wage Countries” the Virtual Production Intelligence (VPI) is being developed. It is a holistic and integrative concept for the support of collaborative planning, monitoring, and control of core processes within production and product development in various application fields. In the context of the VPI, we develop memoSlice, a tool for the explorative visualization of multi-dimensional metamodels that is based on concepts like HyperSlice, parallel coordinates, scatterplots, 3D volume visualization, and navigational aids for multi-dimensional data spaces. The tool is applicable to various scenarios of multi-dimensional data analysis, but the concrete use cases in the current project are the identification of ideal configuration parameters for manufacturing processes and fostering the general process understanding.
We developed a visualization and interaction concept that is easy to learn and provides an understanding of high-dimensional data in different ways. On the one hand, a general understanding of the interdependencies between different configuration parameters is granted. On the other hand, it is possible to identify ideal parameters for a certain use case in a fast, reliable, and simple manner. Both ways are made possible by providing interactive navigation and exploration of the data space which is further supported by introducing methods to lead the user to points of interest, e.g., gradient trajectory navigation, which guides the user to the next extrema in the multi-dimensional data space. A challenge for the realization of this concept is that the evaluation of a data point in the metamodel is computationally expensive. The computation times for slices through the data space rise exponentially with the number of dimensions and metamodels with seven or more dimensions are currently being created by future users. Interactive rendering times can only be achieved by progressive rendering and advanced parallelization concepts.
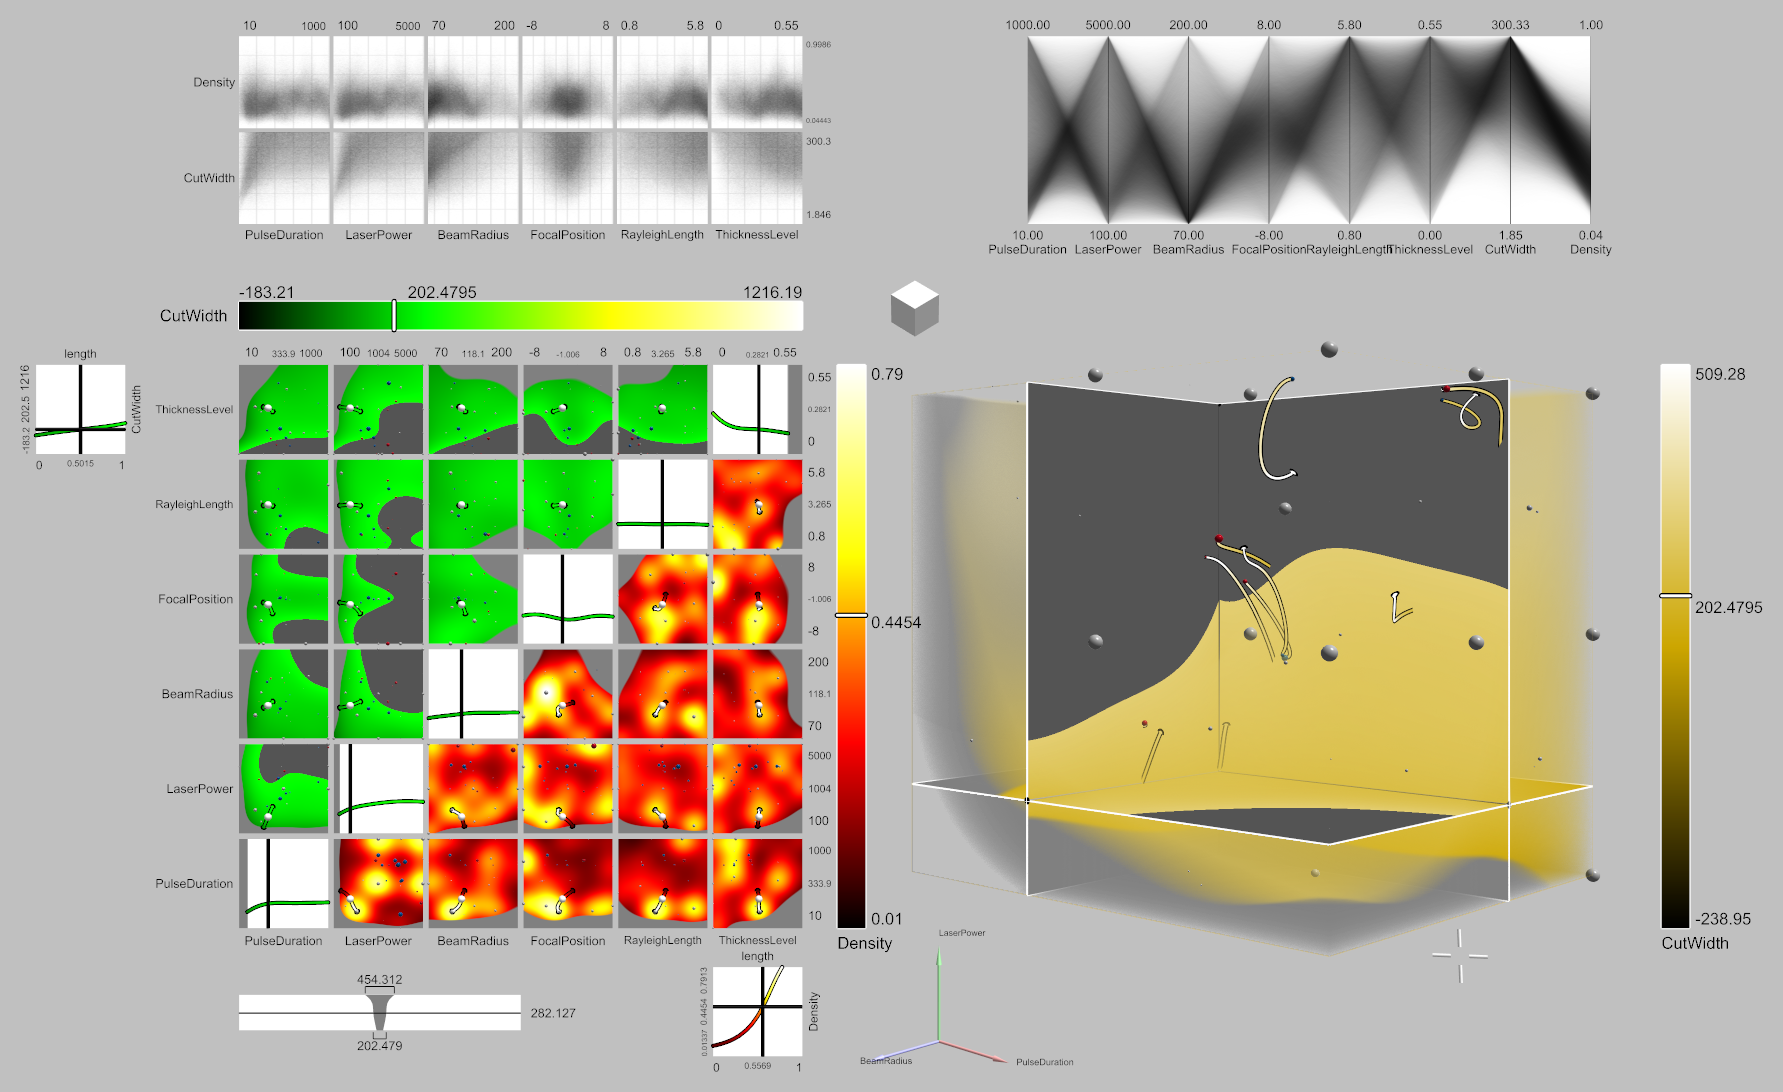 |
| Screenshot of the current prototype of memoSlice. |
Back to project list - Back to top
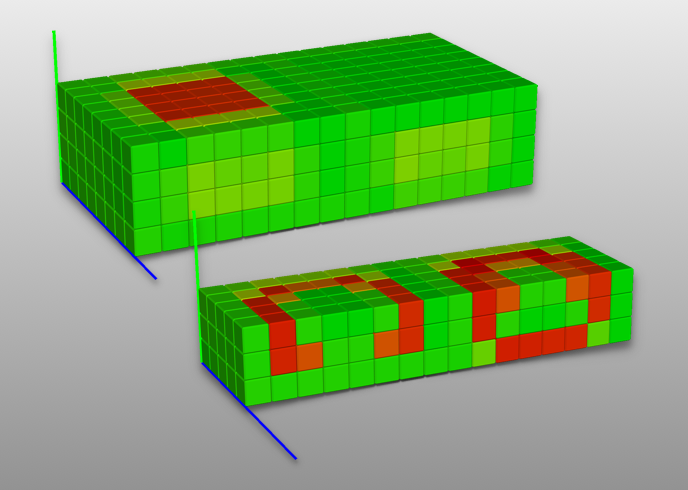
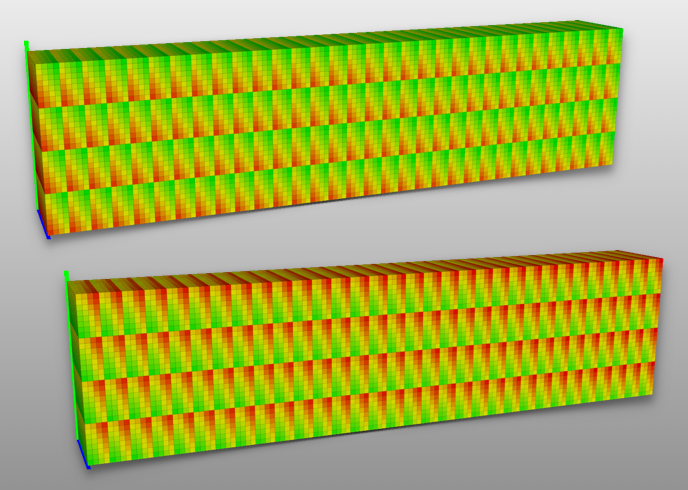
High-performance computing applications ought to make the best use of the available computing resources. Understanding the applications’ performance behavior is thus key in optimizing them. Surprisingly, modern performance analysis tools often leave the analyst with gigabytes of data for manual evaluation. To overcome this, we have developed new techniques and tools for performance visualization and analysis in the joint project “Scalable Tools for the Analysis and Optimization of Energy Consumption in HPC”. Together with our partners from academia and industry, we have enabled developers to evaluate and eventually optimize the performance and energy consumption of their parallel applications.
Finding performance bottlenecks in performance data from millions of threads is as difficult a task as looking for a needle in a haystack. Fortunately, the spectra of the data reveal traces of the said needle: views on the data that very likely reveal performance bottlenecks can be automatically detected. These are then visualized in a 3D view where an analyst can navigate, slice, and filter the data to gain further insight into an application’s behavior. Once a relevant view has been found, automatic correlation analysis helps tracking performance bottlenecks through the complete data set. Exploiting the frequency domain allows for filtering out known sub-phenomena in order to provide new insights.
Performance analysts typically understand visualizations of performance data that has been mapped to the internal layout of a supercomputer. Domain experts that created the simulations to be optimized, however, may find such visualizations hard to read. In order to help them identify causes for performance bottlenecks, we have developed techniques to map the data back onto the simulated geometry and visualize it along with additional statistics. That way, performance phenomena can be easily related, for instance, to an inappropriate distribution of the domain across the available computing resources.
The tools that have been created for analysis and visualization have been publicly released as an open-source library under the terms and conditions of the LGPL v3.
 |
 |
 |
| Slicing and filtering performance data (left), two automatically identified correlated views (middle), and mapping performance data to the simulated geometry (right). | ||
Back to project list - Back to top
Structural plasticity refers to the dynamic creation and deletion of synapses in a neural network and reflects the way the brain develops, learns, and heals. However, the relationship between anatomical connection structure and brain function is still unclear. To this end, large scale simulations of the brain are performed to expose the connectivity between neurons by correlating their electrical activity.
One driving challenge in the exploration of structural plasticity is the parameter space that needs to be navigated. To this end, we developed, in close collaboration, an interactive exploration tool that enables scientists to modify parameters of the structural plasticity model while it is simulated. The tool itself is built on top the previously established methodology of VisNEST: loosely coupled coordinated multiple views communicating via inter-process communication paradigms. This approach allows us to use the visualizations in conjunction with JURECA, a supercomputer hosted at the Super Computing Centre at the Forschungszentrum Jülich.
The tool allows visualizing current calcium concentrations for all simulated brain regions which resemble electrical activity. In addition, it plots each regions’ connectivity count. The parameter steering accounts for the speed at which new synapses can be formed or old ones deleted, general commands to the neural network solver, e.g., to start or pause the simulation, and finally, the minimum calcium concentration that a region should acquire in the simulation model.
In the future, we plan to extend the tool to aid scientists to uncover unexplored parameter space of the model and find connection patterns among neurons that lead to a stable state faster.
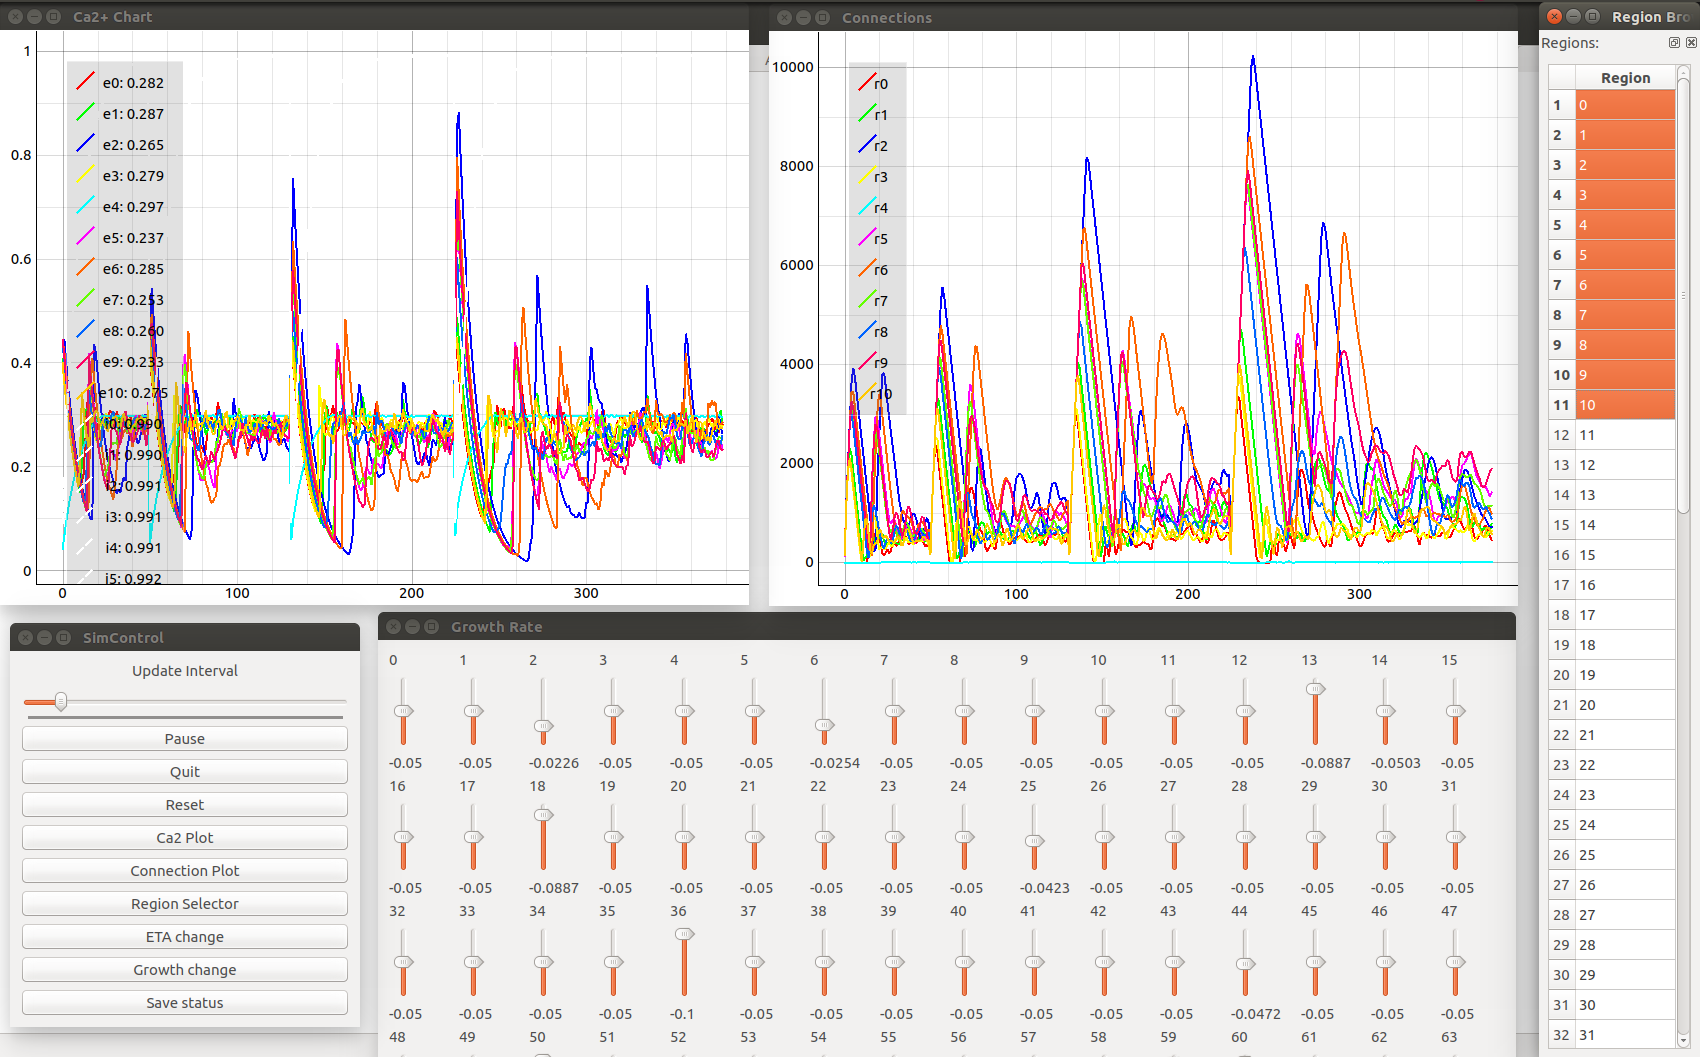 |
| Calcium concentrations and formed connections are shown for simulated brain regions (top left and right). A region selector allows focusing on a subset of regions simulated (to the right). The steering panels (bottom middle) allow for interactive modification of stimulation parameters while a NEST simulation runs in the background. |
Back to project list - Back to top
Graphs are recurrent data structures in data analysis. While the question if non-spatial data can benefit from 3D graph visualization is still open, data with a natural spatial embedding definitely can. However, graphs represented as intuitively readable node-link diagrams tend to become even more cluttered than their 2D counterparts. To this end, this project aims at handling this challenge by developing suitable tools and methods to work efficiently and interactively with 3D graphs.
One method we are utilizing is edge bundling. To reduce edge clutter, this method aggregates spatially similar edges together. We introduce a parallel, edge cluster-based accelerator for the well-known force-directed edge bundling (FDEB) algorithm presented by Holten et al. to achieve interactive frame rates. On this base, a user is able to interactively change bundling parameters or the graph structure itself during the analysis.
In cooperation with neuroscientists from the Institute of Neuroscience and Medicine of the Forschungszentrum Jülich, we are developing a tool for the visual evaluation of the functional correlation of neurons. The data is gathered from the statistical analysis of in vivo recorded local field potential (LFP) signals. The result is a time-varying correlation matrix that is interpretable as a graph. The neurons now can be placed either in their physical location or in a “correlation space”, determined by an interactive layout algorithm with respect to the pairwise correlation. Switching between those positions, or changing the representation of the graph or only for parts of the graph, or visually comparing different analyses on the same or other data sets now allows an analyst to get a deeper understanding of the neuronal behavior.
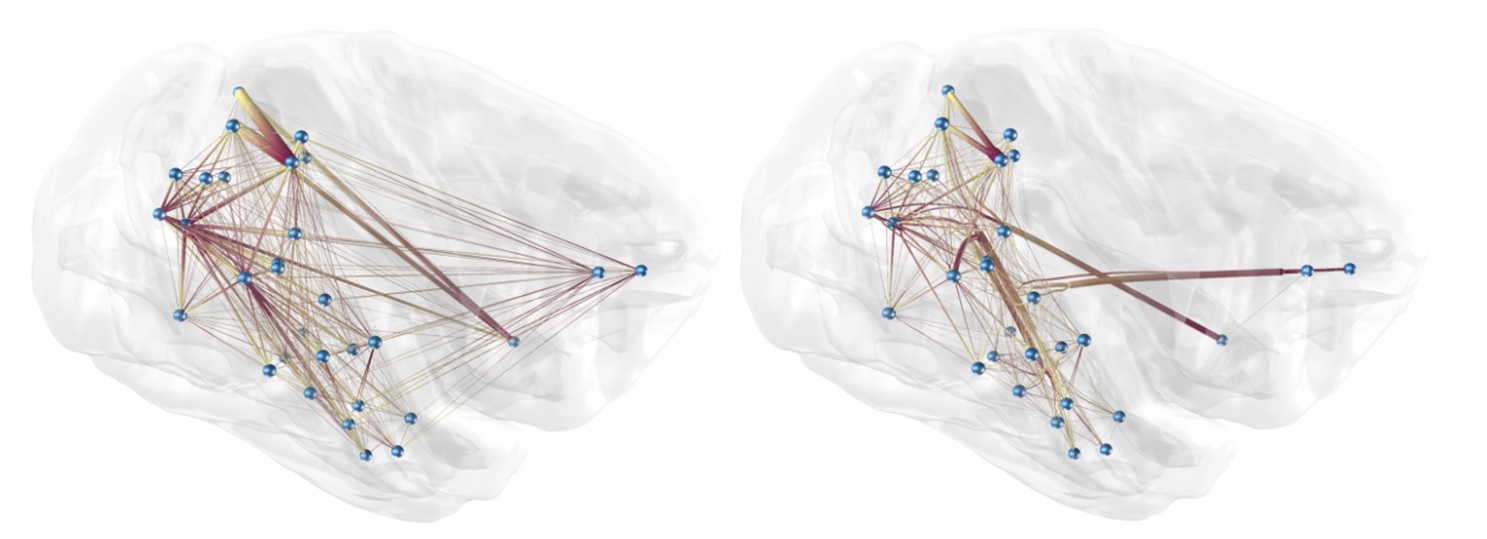 |
| Node-link diagram of an almost fully connected, bidirectional graph, originating from a NEST simulation based on a macaque’s brain [Gewaltig & Diesmann 2007]. This image depicts 32 vertices each of which represents a brain region. The edges are the regions’ interconnectivity. Left: original graph; Right: the same graph after edge bundling; the edges are directed from dark to light. |
Back to project list - Back to top
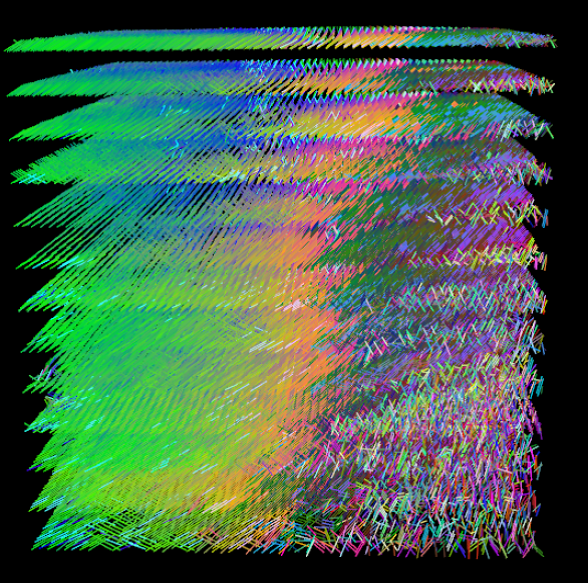
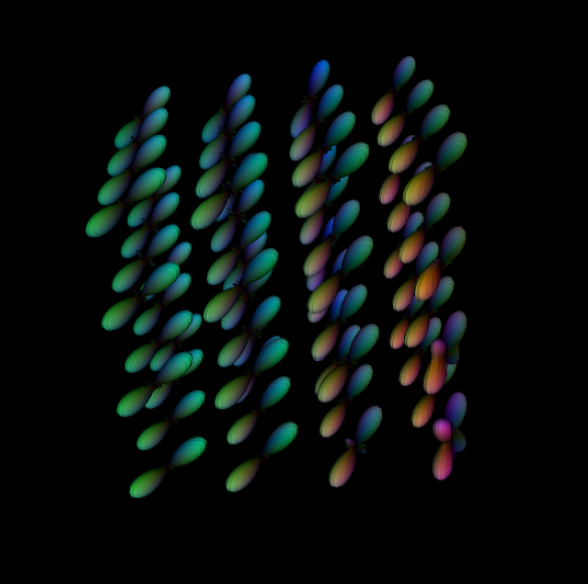
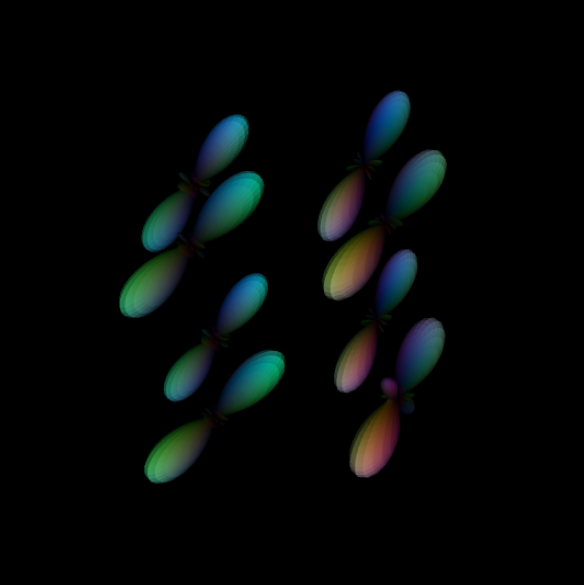
Polarized Light Imaging (PLI) is a rather new technique for acquiring high-resolution data of fiber structures in the brain. Linear polarized light is passed through a thin slice of brain tissue and, thereby, a twin refraction occurs at the myelin sheets around the axons. This allows for a calculation of fiber orientation maps (FOMs) and with that a 3D reconstruction.
The Forschungszentrum Jülich is acquiring PLI data of humans and other mammals. They provide us FOMs accordingly. One major challenge in visualizing these data is to avoid visual clutter especially for the analysis of a three-dimensional stack of PLI slices. The figure below shows a small extract of a vervet monkey brain. In the direct visualization of the FOMs, the fibers in the front occlude the ones in the back. By determining the orientation distribution functions out of these fiber data, we are able to employ spherical harmonics for visualization. In the next step, the spherical harmonics can be calculated for different levels of detail. Thus, information for specific resolutions can be combined into one representation. This is beneficial mainly for two reasons. First, the visual clutter can be considerably reduced while remaining the overall information. Second, the amount of data that needs to be available in GPU memory for visualization can be reduced. For future work, this enables us to provide an application where the user can interactively analyze a whole PLI stack at once despite the fact that the original data would exceed the GPU and main memory. During interactively zooming in and out the spherical harmonics can be loaded dynamically at a sufficient level of detail.
 |
 |
 |
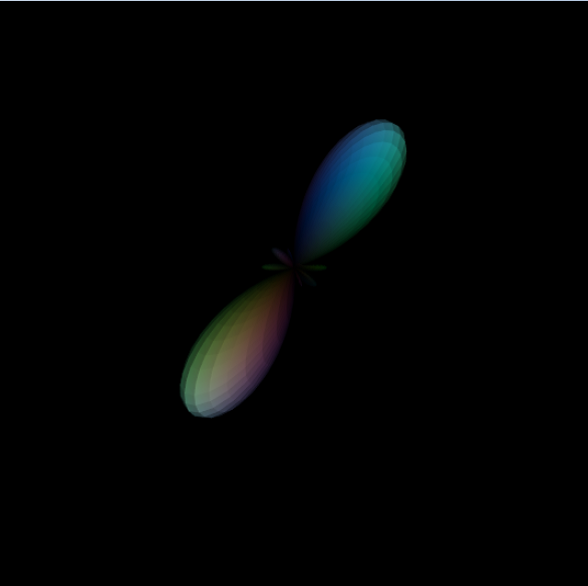 |
| Polarized light imaging data of a region of interest of a vervet monkey brain. The color encodes the fiber direction and, therefore, provides a fast overview. From left to right: direct vector visualization of the fibers; combining information from multiple vectors by means of a spherical harmonics representation; further reduction of the data resolution; a combination of a 64x64x16 vector field into a single spherical harmonic glyph. | |||
Back to project list - Back to top
In the “Cluster of Excellence: Integrative Production Technology for High-Wage Countries” we are developing a flexible platform to enable linked, distributed simulations of entire production processes and appropriate multiple dataset visualization tools to analyze results from those. Our goal is to provide the technological means and methods required to
- Facilitate automated data exchange and transfer of results from one simulation to another.
- Integrate a data translation unit that is powerful enough to convey all the necessary information, incorporating the heterogeneous data semantics between tools.
- Take advantage of distributed soft- and hardware resources with an appropriate middleware that has a sufficient layer of abstraction to encapsulate system-specific details behind a standardized interface.
- Establish a unified mechanism to describe single simulation jobs as well as complex workflows consisting of several simulations working hand in hand to model a certain production process.
- Gain further insight and understanding of the process as a whole using leading edge
 |
| Collaborative Analysis of a process chain in the CAVE |
Back to project list - Back to top
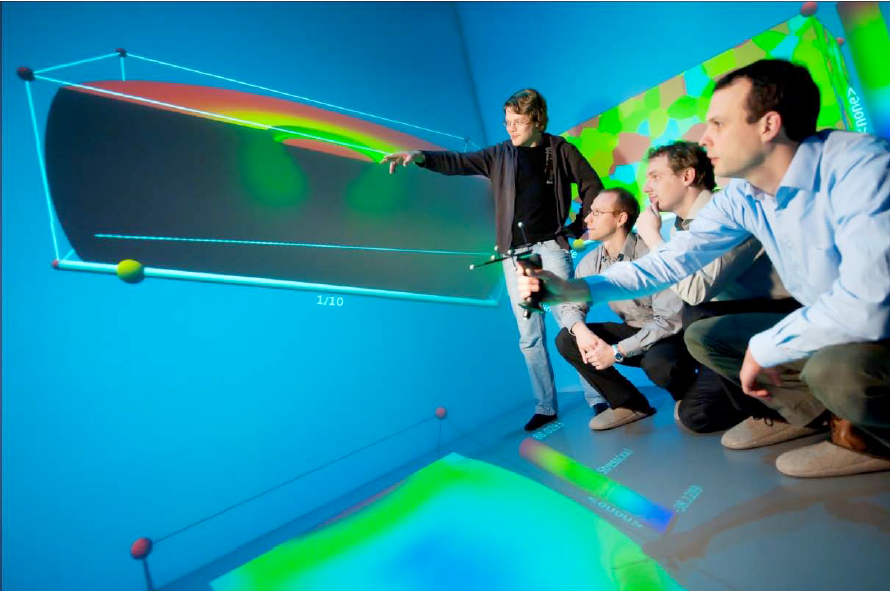
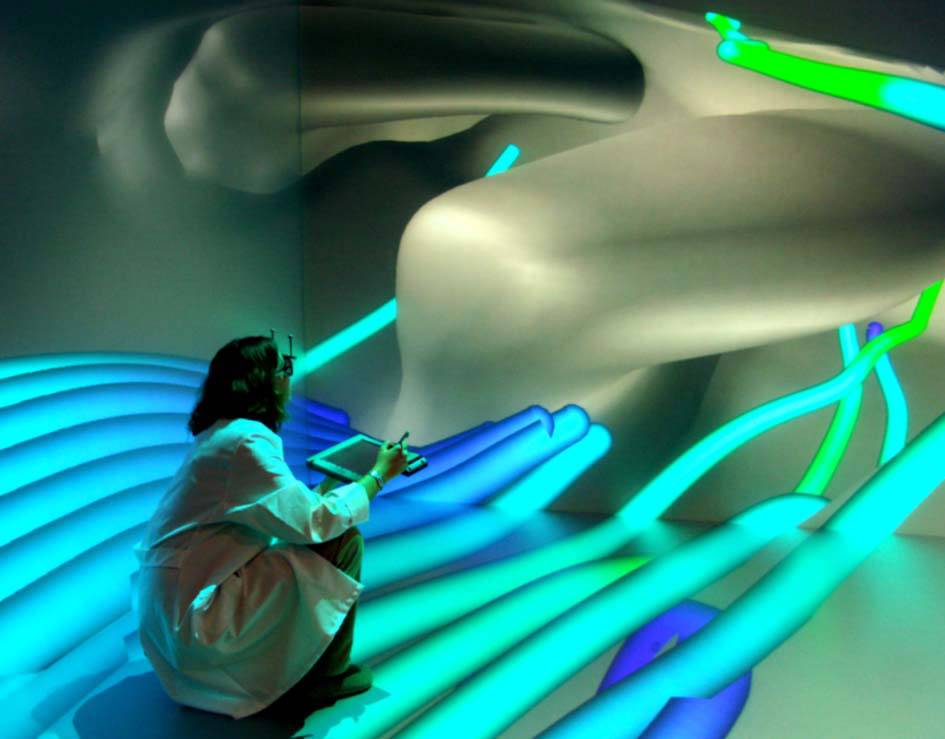
The Virtual Reality Group participates in an interdisciplinary research project kindly funded by the DFG, investigating the airflow inside the human nasal cavity. The human nose has to satisfy a variety of different functions. Besides respiration, it is responsible for moistening, tempering, and cleaning the air. These functions are expected to strongly depend on the complex internal geometry of the nasal cavity. Impaired nasal respiration especially under normal breathing conditions, i.e., in everyday life situations, is a common and widespread disease, which makes nose surgery one of the most frequent operations in the western world. Unfortunately, the success rate, i.e., the number of people having no problems after surgery,
is by no means satisfactory. To enhance this situation, researchers from the fields of fluid mechanics, medicine, and computer science cooperate in an interdisciplinary research team. The main goal of this effort is to devise objective criteria that on the one hand quantify the quality of a given nasal cavity’s flow field and on the other hand help to predict the outcome of a surgical intervention. In this project, the Virtual Reality Group is designing new,
interactive visualization methods which are custom-tailored to the investigation of the nasal cavity. The work is split up into four main strands:
In the first step the complex nasal geometry had to be visualized. Unlike in most other simulation output analysis settings where the shape of the simulated domain is some form of artificially created geometry, the highly complex, natural shape of the cavity poses major problems inhibiting an efficient navigation. A combination of CT-data displays used as a “map” of the nasal cavity and direct 3D interaction techniques has been used to solve this task.
The second field of work arises from the fact, that in order to understand the influence of the nose’s main anatomical components, flow simulations have been performed for different nasal geometries. A manual, purely image-based comparison of the results would have been very tedious and time-consuming. Therefore, a set of visualization techniques has been devised that are used to assess the differences of the various data sets more efficiently. These techniques facilitate a direct comparison on the raw data level, either using a set of similarity metrics to show a global image of the data set similarities or by providing the user with 3D point probes that allow to locally assess any two data fields at the same time.
Third, in order to integrate the expertise from different research fields, the development of the virtual annotation system IDEA (Interactive Data Analysis and Annotation) has been started. This system combines an underlying model which links meta-information – the annotations – to respective parts in the scene. The annotation data is saved to a database along with the annotated scene data for later restoration and follow-up analysis.
Finally, the fourth part of the project deals with the integration of quantitative data into the analysis process and the interaction therewith. Here, concepts from information visualization are transferred to a 3D immersive setup. Ultimately, this will lead to a comprehensive set of methods that allow the interactive specification, extraction, quantification, and follow-up assessment of arbitrary data characteristics. Based on these, aerodynamics engineers will be able to easily identify areas where certain combinations of values are present in the data and to cross-link this data to medical statistics on the nasal respiration. Ultimately, this cross-referencing should lead to the establishment of the aforementioned objective criteria, which facilitate an evaluation of any given nasal geometry.
 |
 |
| Photos of the current prototype being used in the CAVE. | |
Back to project list - Back to top
Within the Jülich Aachen Research Alliance (JARA), we have developed an interactive visualization for simulated ventricular assist devices in cooperation with Prof. Marek Behr, Chair for Computational Analysis of Technical Systems (CATS).
A ventricular assist device (VAD) is a mechanical blood pump to support a patient’s weakening heart, which can help a patient to survive the waiting time until a suitable heart transplant is available. The long-term goal is to enable a permanent use of VADs, and thus obviate the need for a heart transplant. One of the main concerns in the advancement of the current VAD generation is blood damage (hemolysis), in which the blood cells’ content leaks into the surrounding blood fluid.
To analyze the cause of blood damage and facilitate the optimization of the VAD design, CATS developed computational methods to simulate human blood flow. The computation considers not only standard flow features, but also the impact of the flow on the blood cells which enables a prediction of the rate of hemolysis.
As the computation quantifies the impact of the flow on the blood cells by their deformation, the visualization depicts this feature by morphing, semi-transparent ellipsoids. The main axes of the ellipsoid are not only shown to illustrate the deformation, but also to enable the observation of the so-called tank-treading of the blood cell. This is a natural protection mechanism of red blood cells in a shearing flow. To give an overview of the whole deformation process, the visualization application provides a static view, which is inspired by the multiple exposure technique in photography. This static overview can be used as a means for navigating through the time dimension. By picking one of the ellipsoids along the pathline, which is also a timeline, the user jumps directly to the time step corresponding to that position of the blood cell.
 |
 |
| Direct interaction with the data allows an intuitive navigation in space and time. Here, a user picks a particle instant in order to navigate to a specific point in time. |
Back to project list - Back to top
GTECS3D is a joint work with the Section C for Mathematics and the Department of Inorganic Chemistry funded by the Excellence Initiative in the period 2011/2012 with the aim of accelerating the analysis of crystallographic structures. This was done by developing a tool for semi-automatic simplification and analysis of crystal structures. The interaction is based on a basic UI providing several simplification algorithms searching for well-defined substructures within the crystallographic structure and either removing or combining them. The complete crystallographic structures as well as all results of the simplifications are thereby presented visually.
For a better visibility of connections within more complex structures with a large number of atoms we now extended the visualization part. For this we added gooch-shading instead of the standard phong lighting model. Additionally we use halos with the advantage to detect the order of partially occluding atoms and bonds. In the near future these changes will be evaluated within a user study.
In addition to the visual improvements we accelerated the algorithmic analysis by including a batch mode for a parallel simplification of multiple structures. This implies also a faster comparison of similarly structures.
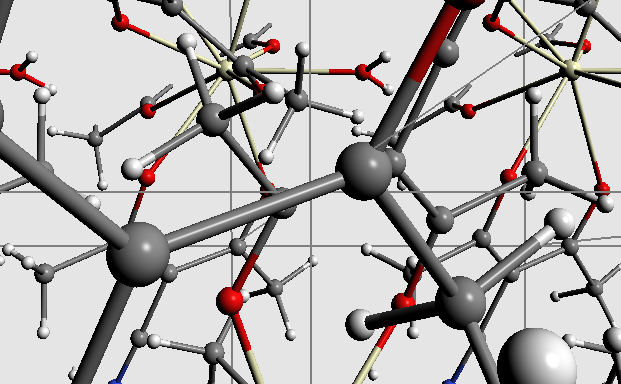 |
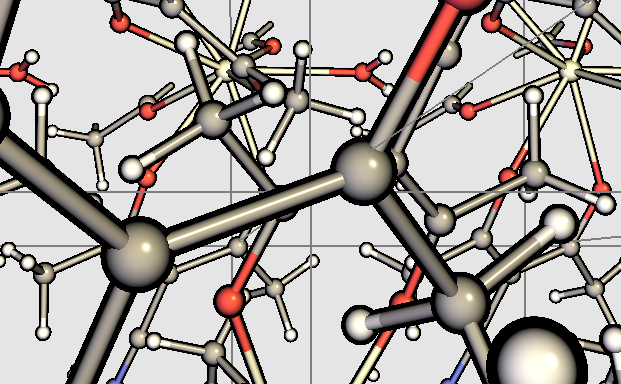 |
| Visualization of crystallographic structures with phong shading (left) compared to an improved visualization with gooch shading including halos (right). | |
Back to project list - Back to top
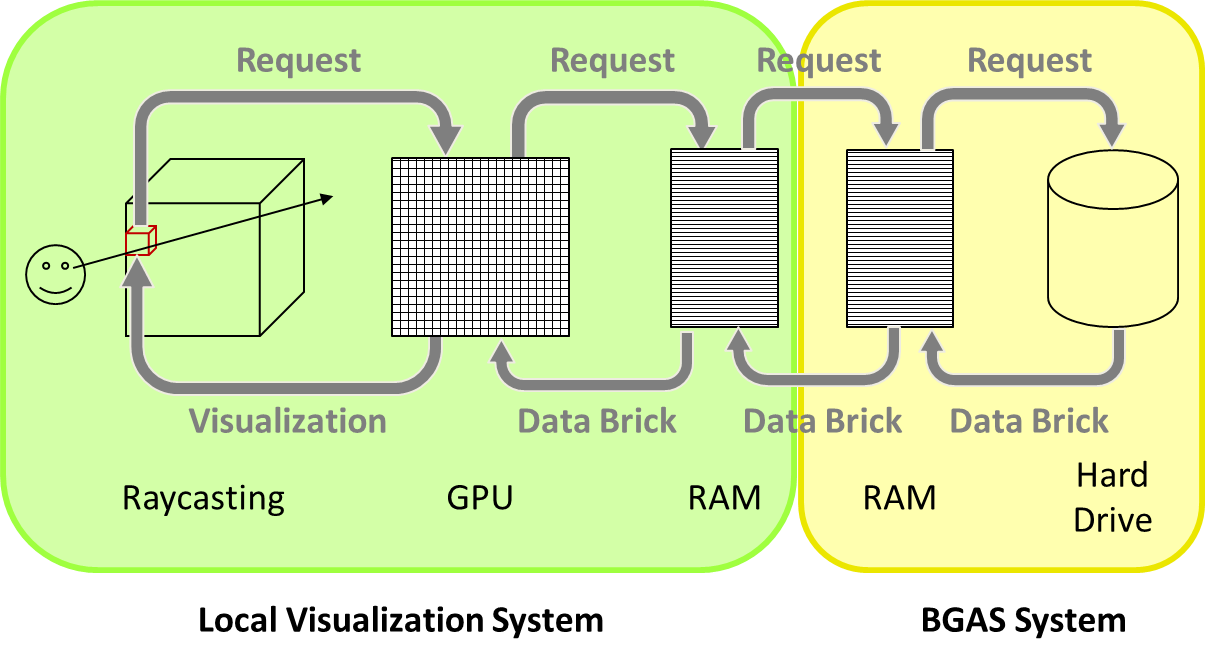
In different research areas large amounts of data are generated, e.g., by complex experiments or simulations. The analysis and visualization of these data are becoming an increasing challenge. In this project, we focus on direct volume rendering as a visualization technique. To be able to store and process the large data, we are implementing a virtual storage hierarchy. We develop a hybrid rendering architecture consisting of remote large data storage and local, interactive rendering. It relies on the observation that at any given time, only a fraction of the overall volume is required to generate a suitable image from a given vantage point. Typical acceleration techniques such as early ray termination and empty space leaping can be used to aggressively limit the amount of required data. Moreover, LOD approaches can be used to represent the data at a suitable resolution with respect to the current screen resolution. This further reduces the data footprint for rendering.
For the implementation of the virtual memory hierarchy, we use a client-server system, consisting of a visualization workstation as a client and the BlueGene Active Storage architecture on the server-side. With this setup we strive for an interactive visualization of large data in immersive environments.
 |
||
| Architectural sketch of the virtual memory architecture. Requests for missing volume blocks for visualization are forwarded in the system hierarchy and the corresponding data items are transferred back for local rendering. At each point in time, only a small fraction of blocks has to be held in local GPU memory. | ||
Back to project list - Back to top
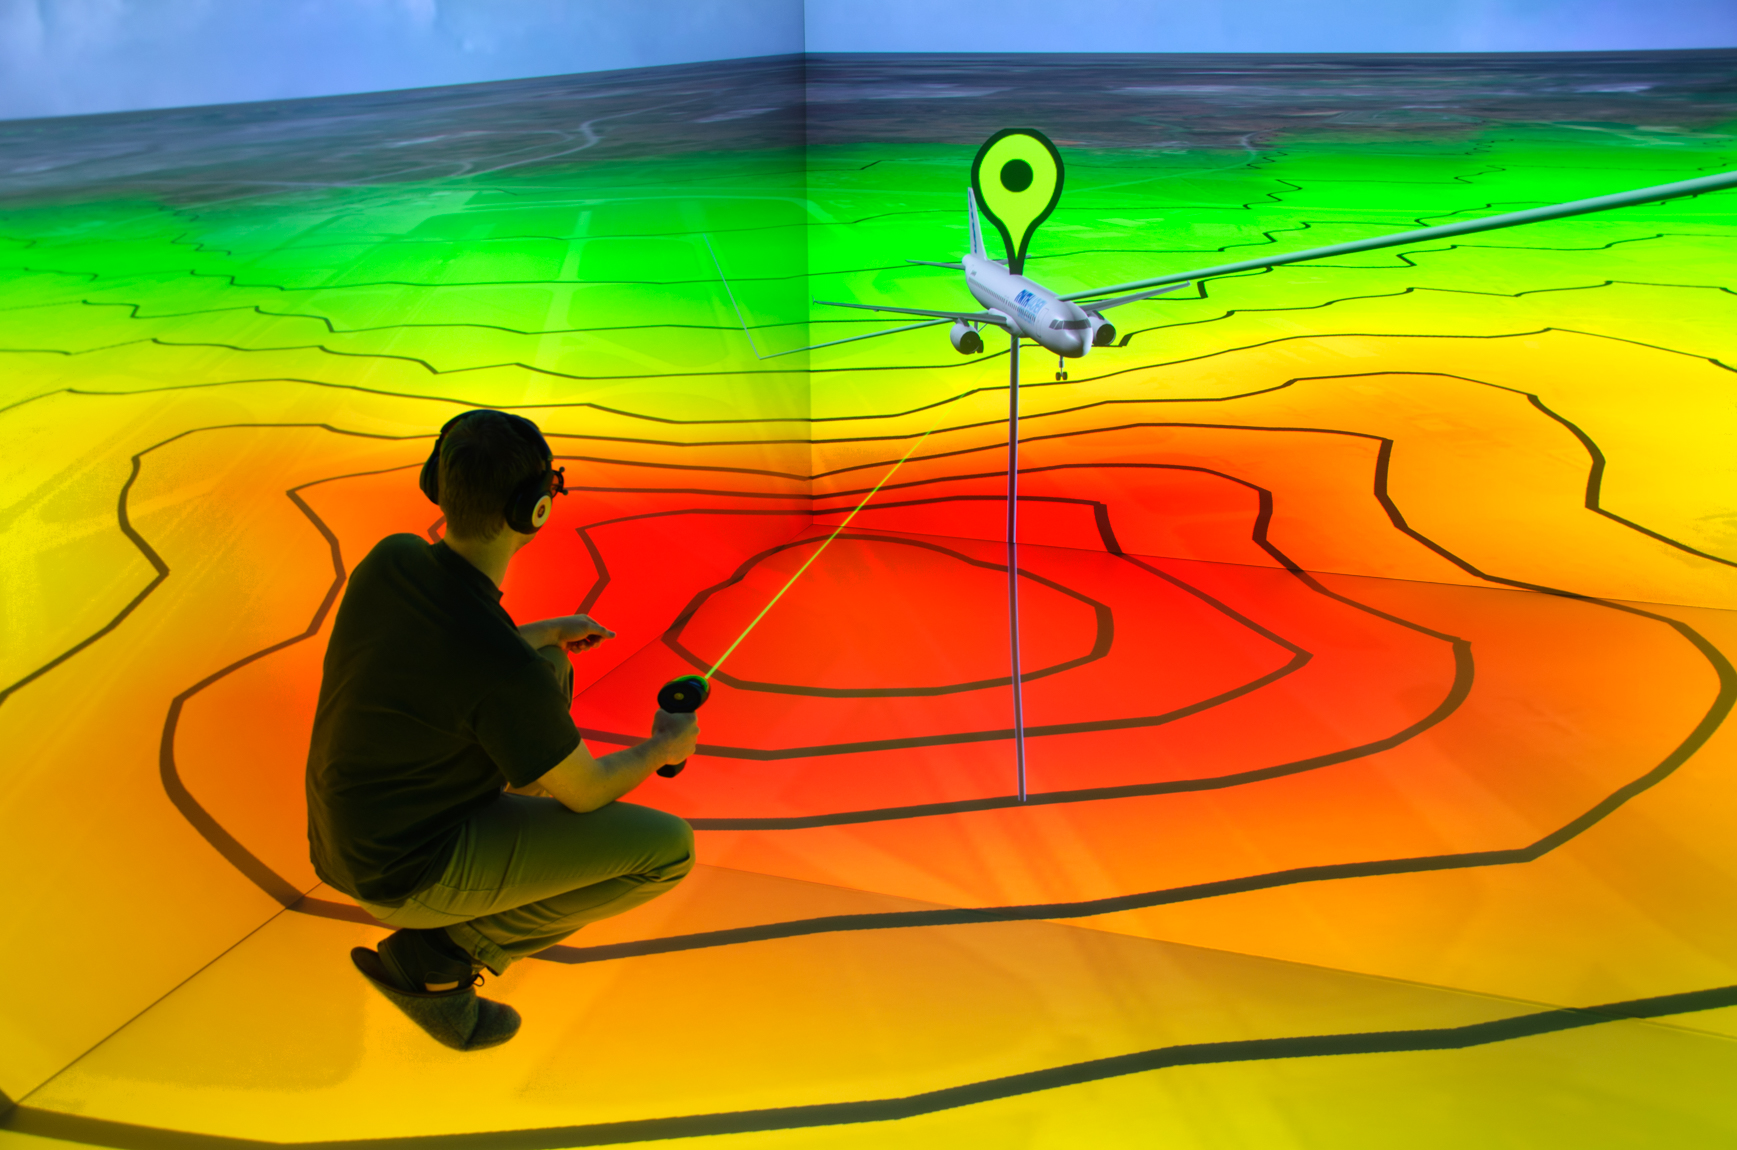
VATSS is an interdisciplinary research project in cooperation with different institutes of the RWTH Aachen including the Institute of Aeronautics and Astronautics (ILR), the Institute of Technical Acoustics (ITA), the Department of Geography (GEO), and the Chair of Air Transport and Airport Research (VIA). It is funded as an Exploratory Research Space (ERS) Boost Fund Project. The goal of the project is to simulate the different aspects of air traffic and integrate these simulations into an immersive virtual environment that aids the exploration of the effects of air traffic.
As the amount of air traffic continually increases, it becomes necessary to expand airport infrastructures and develop new, more efficient air traffic concepts. These steps involve the analysis of ecological, economical, and social factors which lead to decision-making processes in various areas related to aviation, e.g. airport planning, creation of flight schedules and routes, research & development of new aircrafts and landing procedures, and the communication with local residents (non-experts). With this project, we try to provide assistance in these decision-making processes.
Currently, we are creating a realistic model of the environment around airports, which includes the simulation of the weather condition. Based on this environmental model, several simulations are developed which accurately reflect different aspects of air traffic, like the movement of aircrafts and their ground noise impact. The results of these simulations are then integrated into an immersive virtual environment that allows experts as well as laymen to explore the effects of air traffic. To allow for an intuitive understanding of aircraft noise, one subtask deals with the development of an approach to accurately synthesize aircraft noise in real-time to provide a realistic, audible signal within the virtual environment. At the same time, we implement visualization techniques that allow a precise access to indicators like the ground noise impact. The creation of intuitive interaction techniques for navigation, system control, and data annotation is the focus of another subtask.
 |
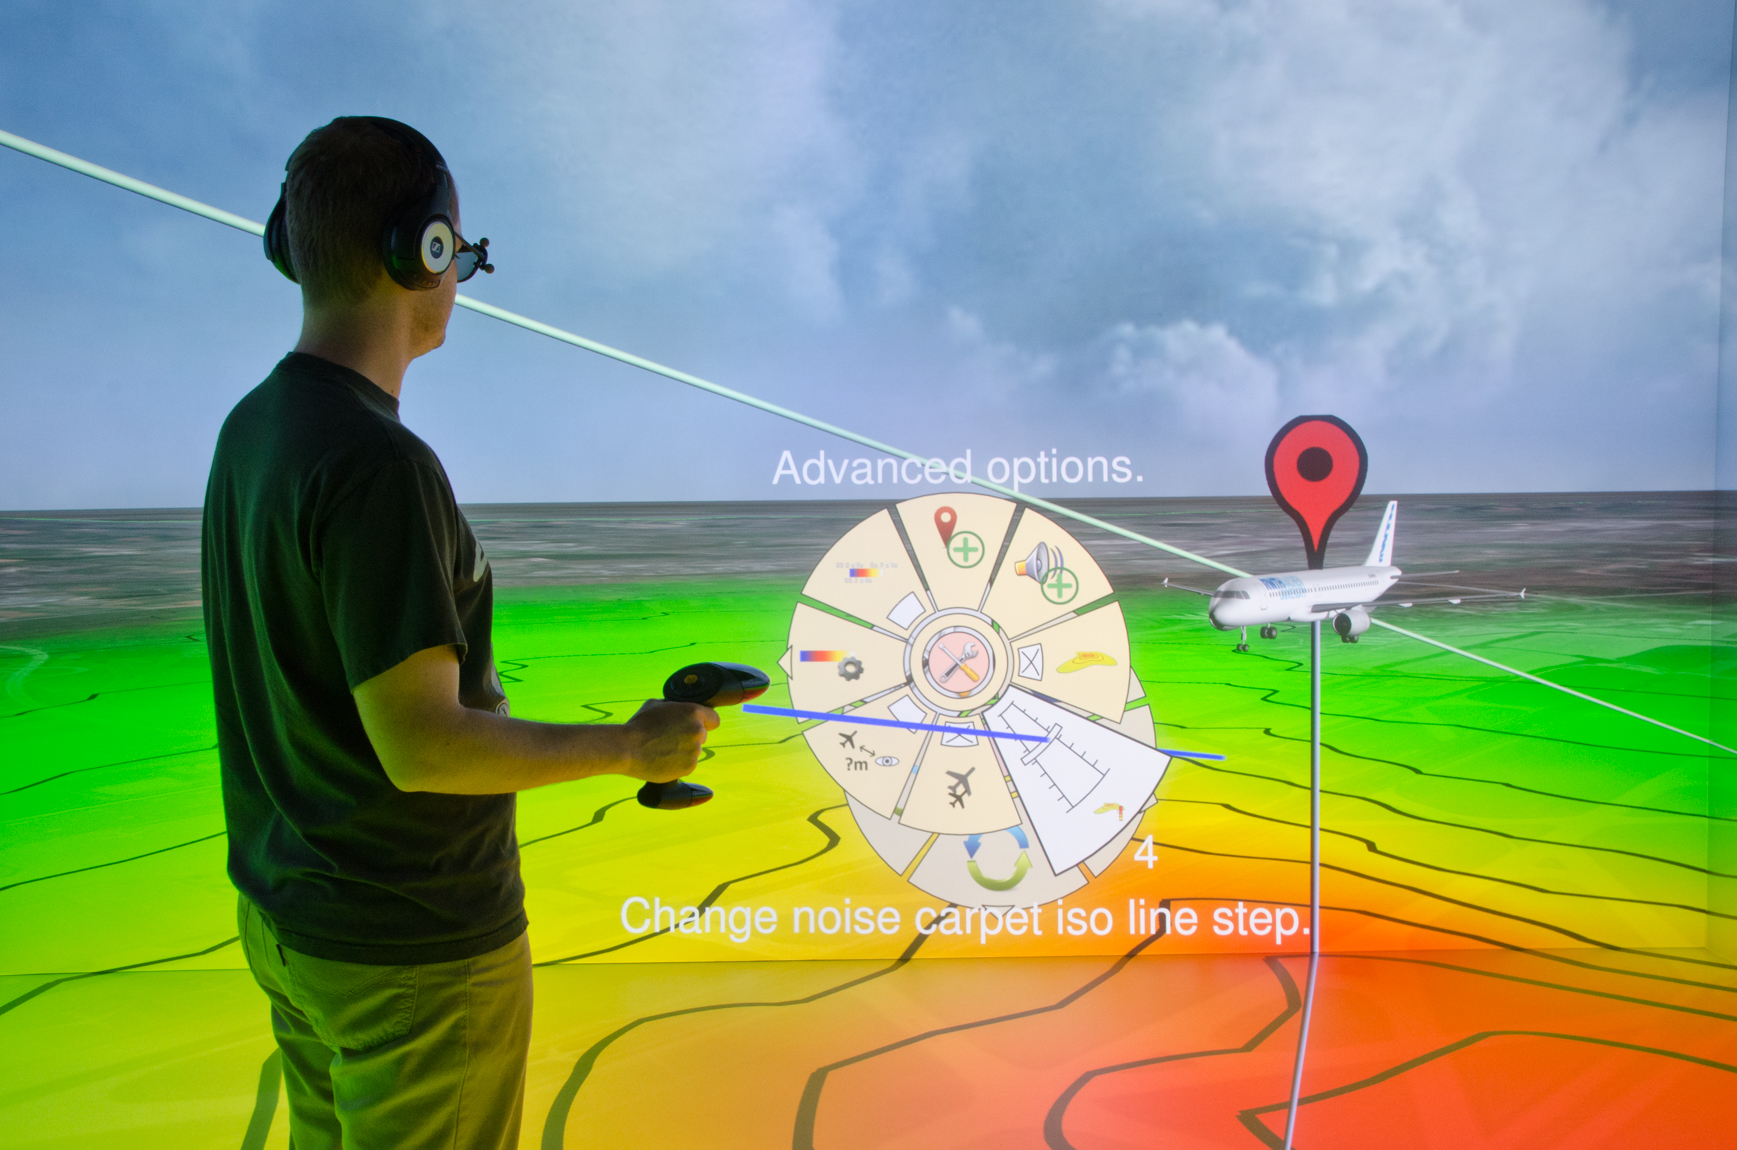 |
| Photos of the current prototype showing a noise carpet (left) and the menu interaction (right) in the aixCAVE. | |
Back to project list - Back to top
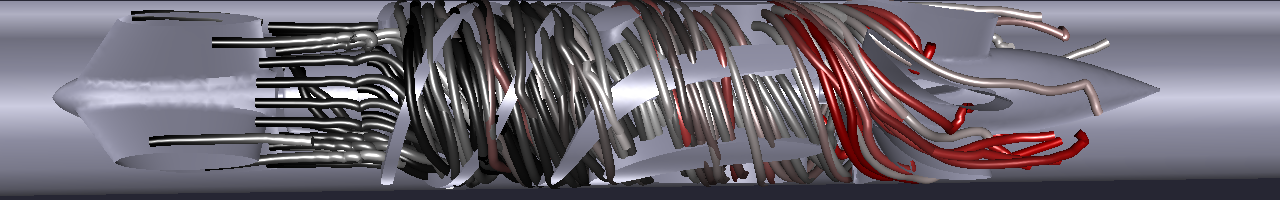
The overall goal of this project is to broaden the understanding of small-scale turbulence based on high-resolution direct numerical simulations (DNS). To this end, the flow field is partitioned into geometrical structures named dissipation elements, which are defined by the project partners from fluid mechanics based on theoretical considerations. In order to analyze these structures and the turbulent flow, advanced visualization methods are developed.
From the visualization perspective, the main contribution in this project is tracking of these structures’ temporal evolution in order to facilitate an understanding of their time-dependent dynamics. Challenges arise from the fact that all underlying structures are space-filling by definition and rather small compared to the overall size of the simulation domain. The first aspect means that for anyone structure in a given snapshot of the simulation there are a number of potentially matching candidates in the following time step; topological events such as merges and splits further aggravate the situation. The second aspect, i.e. the structures' small scale, results in a large number of them. This in turn leads to a requirement of efficient, parallel algorithms in order to process them in an acceptable time frame.
The solution is based on a two-step optimization approach which consists of two graph optimization problems. After the extraction of features in subsequent time steps, first, one-to-one assignments between the features are resolved by computing a maximum-weight, maximal matching on a weighted bipartite graph. Second, we construct a graph of non-trivial, potential explanations – i.e., splits and merges – for all feature objects that have not been covered in the first step. A valid solution is found by formulating the problem as a search for a maximum weight, independent set.
Additionally, different strategies for a formal validation of the tracking results are investigated. Due to the lack of ground truth data, a set of options to validate the results is developed. Combining these options offers a more meaningful evaluation of the approach.
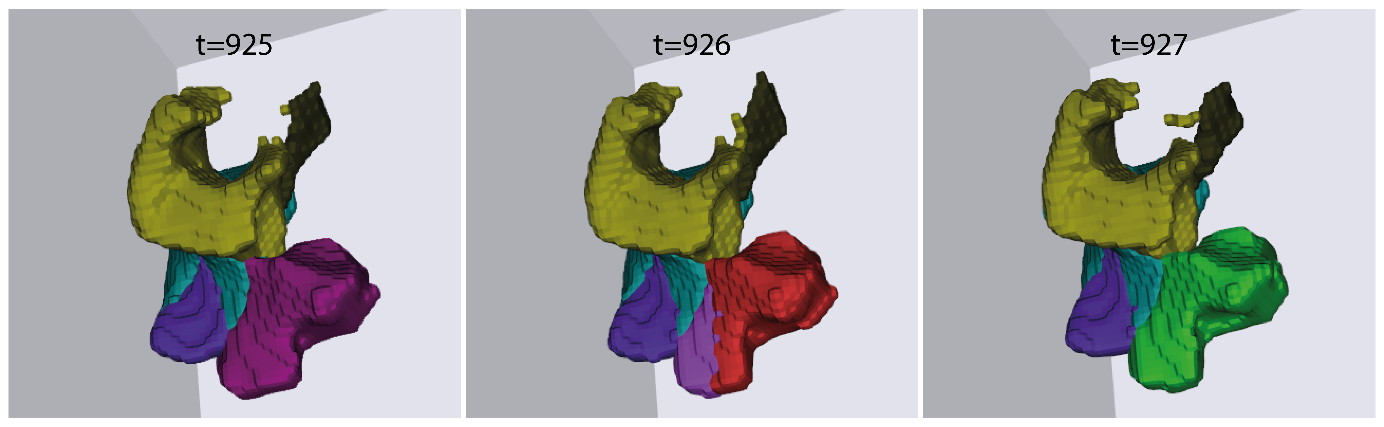 |
| Depiction of a fast splitting and merging sequence of selected dissipation elements in a ?256?^3 isotropic turbulence data set. While the amber, dark green, turquoise, and cyan elements in the left portion of the image remain largely stable, the violet one first undergoes a split followed by an immediate reconnection. The dense packing of elements illustrates the challenges of tracking space-filling structures. |
Back to project list - Back to top
In order to successfully and economically generate geothermal energy, several non-trivial factors are required. First, a geothermal site is needed that provides high temperatures of 150 – 200°C at an efficiently reachable depth of less than 5 km below the surface. Secondly, the rock formations have to be permeable enough to allow water to pass through in order to be heated up. Thirdly, geologists need information about where such connections exist in order to place production boreholes at optimal positions.
In order to reduce the number of highly expensive exploration boreholes, geologists run extensive simulations of the possible subsurface structure and resulting underground flows. As these results can quickly become very complex, and contain features not expected beforehand, they have to be visualized to efficiently understand these reservoirs and ultimately help in deciding where the next borehole should be placed, but also to improve existing modeling procedures and simulation algorithms.
An important part of these simulations is the inherent uncertainty at every stage in the process, due to the very limited amount of information available from existing boreholes, seismic measurements, and geological models. Hence, in addition to state-of-the-art visualization techniques including direct volume rendering, isosurfaces, planar slices, lower-dimensional sampling, interactive particle tracing, and stream tracing, and line integral convolution, tools are provided to efficiently and interactively explore large ensemble sets of simulation results and visualize scalar uncertainty. Additionally, tools to improve the geoscientific workflow, including not only the visualization of simulation results, but also data processing and result communication, are designed and developed in collaboration with the domain scientists.
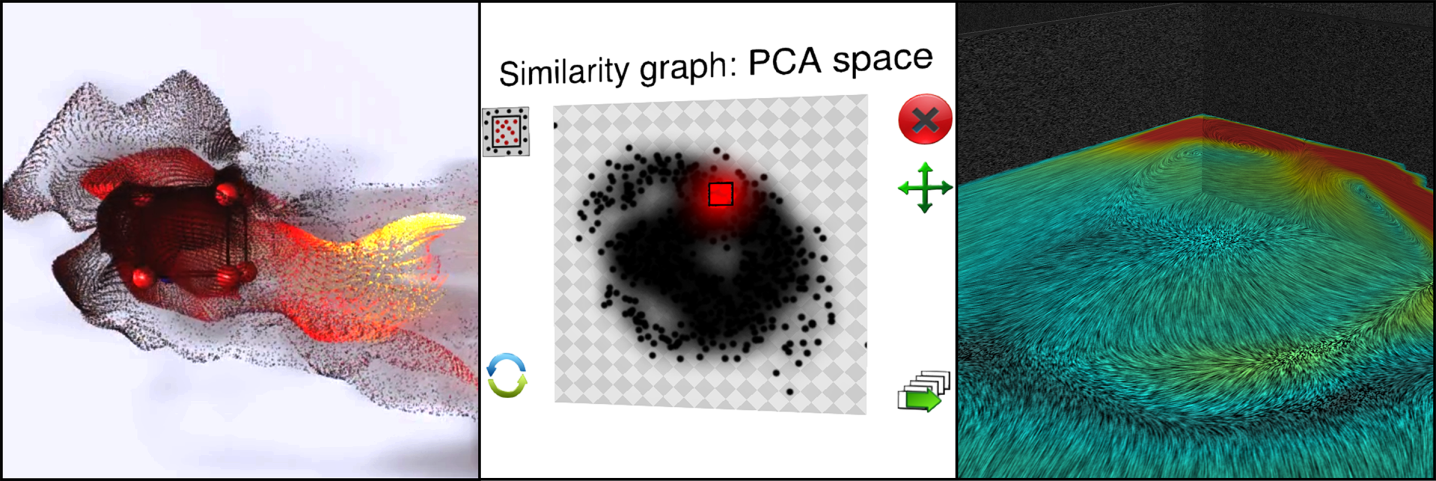 |
| Left: Particle tracing visualizing a vector field. Center: Lower-dimensional representation of a large ensemble that can be browsed by similarity. Right: Line integral convolution visuali-zation. |
Back to project list - Back to top
Ultrasound (US) imaging allows immediate and interactive visualization of internal body tissue. It is safe and less expensive than the alternatives: computer tomography (CT) and magnetic resonance tomography (MRT). It is therefore gaining popularity in diverse areas, where it is used as a complementary tool in diagnostics and operating rooms. However, training of ultrasound is traditionally learned by doing with supervision, in hands-on workshops, or by looking at images, videos, and other didactic material; and the needed field experience is often hard to come by due to the lack of training opportunities.
Continuing with the work done during the previous year, the Ultrasound simulation has been fully integrated into a virtual reality-based training simulator for Regional Anesthesia procedures within the RASimAs project funded by the European Commission. To this end, this year’s work has been focused on improving the stability of the simulation and the exchange of data between the ultrasound simulation module and the main training simulator.
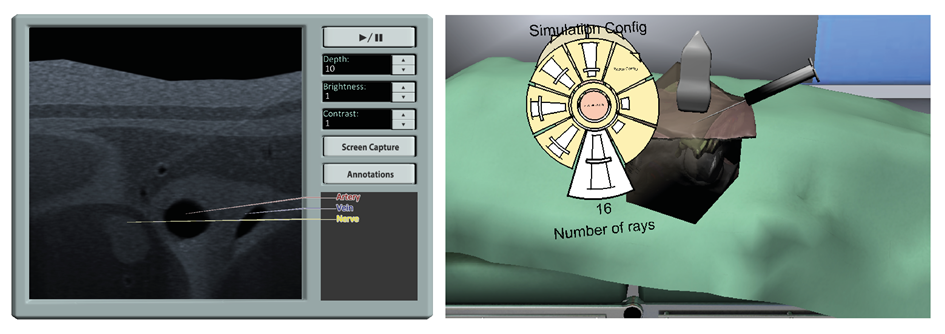 |
| View of the synthetic ultrasound image and virtual device panel for the training simulator application. |
Back to project list - Back to top
A challenge in biology is to teach cardiac psychology in a practical way. Until now, students have been taught this with the help of crayfish in a lab course, to get a better grip on the topic. These were dissected and the students were asked to perform experiments on the active heart.
In the experiments, the heart was injected with two substances that alter the hearts amplitude and frequency. The typically used substances here are adrenaline and acetylcholine, which have opposite effects. On the open heart, the students then measured the response of the heart regarding the applied substance concentrations. Due to rejection by students and newer guidelines, such animal experiments are getting less common due to the amount of paper work required and the ethical issues.
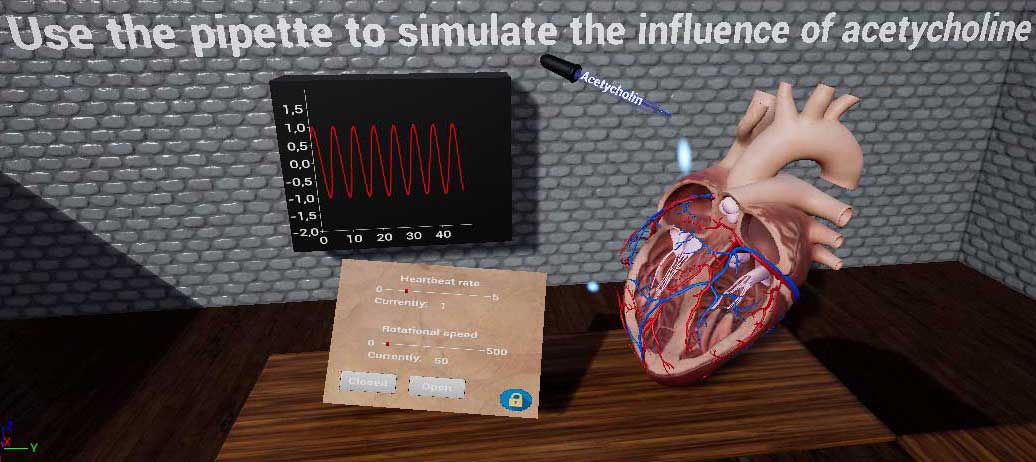
To give an alternative, we develop a virtual reality application to mitigate some of these challences in cooperation with the Chemosensation Laboratory of RWTH Aachen University. In the future, this application shall replace the alive crayfish and allow easier execution of the experiment. For this purpose, multiple Oculus Quests are used as a hardware platform, which are non-stationary VR headsets. The focus is on an immersive experience with best possible simulated test results.
In the developed application, the user can execute the different steps of the real experiment on a virtual heart. For this, the virtual heart has two instances, one of which shows a cross-section to enable the students to see the inside of the heart. Since the experiment in its original form should show the effects of the different substances on a crayfish heart, this is changed to a human heart in the simulation. The virtually measured responses of the hearts can be recorded and exported to allow for the usual written report of the experiment execution.
 |
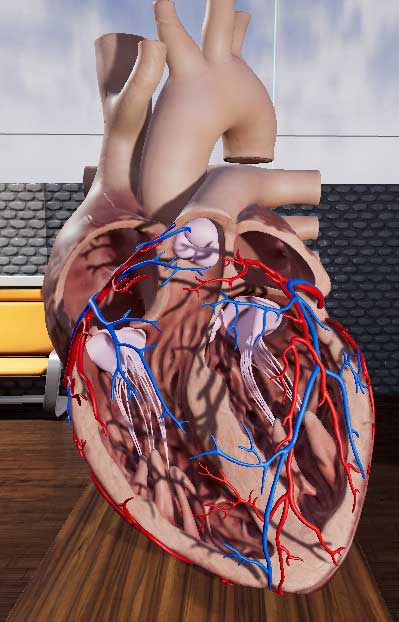 |
| Overview of the VR-based application (left) and a close-up of the open human heart (right). The 3D model of the heart is taken from here. |
|
Back to project list - Back to top
In this project, we are investigating the requirements for and possibilities of desk-based virtual reality applications, with a special focus on productive working environments, e.g., data analytics. Due to the emergence of low-cost consumer virtual reality hardware, immersive data analytics has recently been brought back into the focus. Previous research has shown the positive impact of immersive visualization on data analytics workflows, but in most cases, insights were based on large-screen setups. In contrast, less research focuses on a close and thus seamlessly accessible integration of immersive technology into existing, i.e., desktop-based data analytics workflows. This scenario provides some rare factors, one being that the user is usually seated; another that the surrounding real-world environment is also very dominant, e.g., the office desk. In this project, we are dealing with the changes and challenges of this scenario, containing seated virtual travel, office desk substitution, passive haptic feedback, and the prevention and reduction of cybersickness.
 |
Back to project list - Back to top
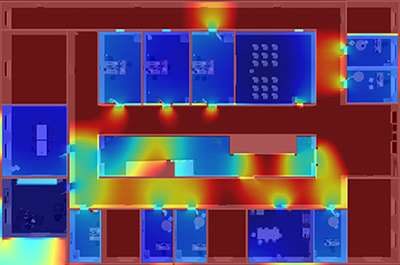
Navigation – moving and finding your way through a virtual world – is one of the most basic tasks in Virtual Reality, and necessary in almost all applications. However, there is no general solution that enables natural, efficient, and comfortable navigation throughout all environments. Instead, trade-off decisions have to be made between naturalness, efficiency, complexity, comfort, usability, and general applicability, and usually, navigation techniques are tailored to a specific use case or scenario.
An automated understanding of the virtual scene – or parts of it – has the potential to alleviate these trade-offs. For example, knowing where a user might want to go, or which parts of a virtual environment they might find interesting can help the system in supporting the user to get there efficiently. This can be done, for example, by facilitating interactions, correcting user errors, making suggestions, or displaying context information.
To this end, we develop methods to efficiently and automatically analyze virtual scenes in order to understand the structure and semantics of a virtual world, such as objects, connections, rooms, visibilities, or landmarks. Furthermore, we use this information to create user interfaces that aid users when they move through virtual worlds, for example, by controlling movement speed, or suggesting alternative viewpoints or possible navigation targets.
 |
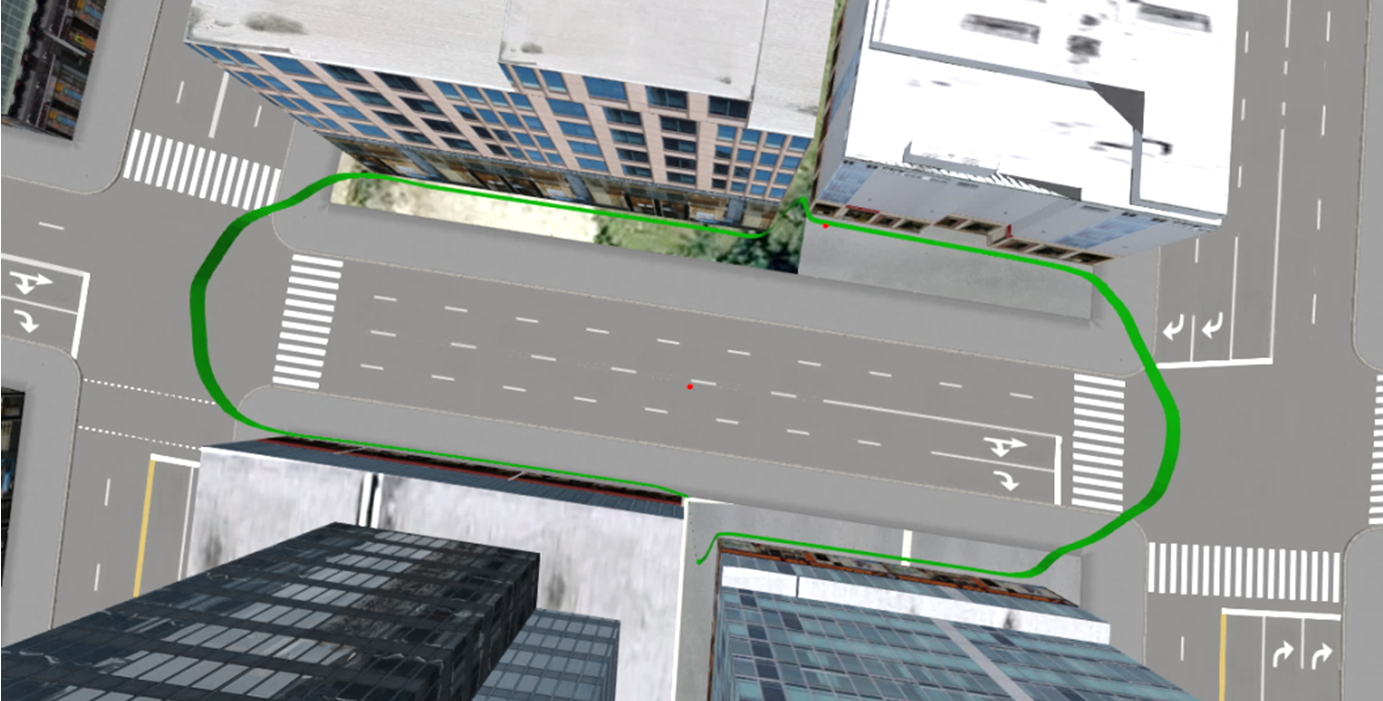 |
| Left: Automatic computation of suggested movement speeds based on scene detail in a virtual office. Right: Computation of regions with mutually similar scene visibility to determine structures in a virtual city. | |
Back to project list - Back to top
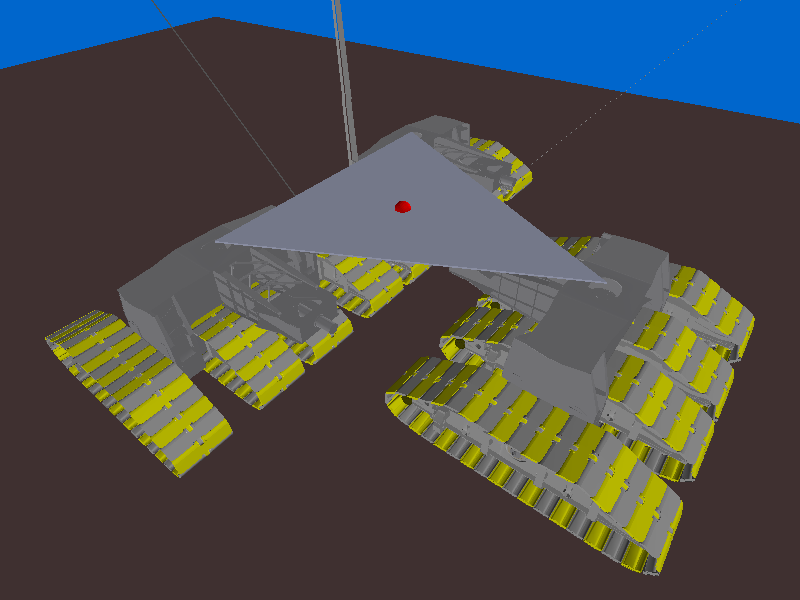
Using real-time physic computations for visualizations in virtual environments aims at increasing the realism and therefore the sense of presence to the human perception. In contrast so-called multibody simulation programs - used for virtual product development (VPD) - focus on physically correct results instead of being real-time applicable. Nevertheless, once those simulations have finished computing the final results, it remains essential for the understanding of the simulated underlying phenomenon that its representation can be achieved interactively. Hence the animation that visualizes the process has to remain fluid to provide insight. If so, it gives the opportunity to analyze complex kinematic systems for example complete undercarriage of a bucket wheel excavator for geometry optimization of parts and control systems in the design process. The presented model of the bucket wheel excavator is originated from project works with RWE Power AG.
The real-time aspect required for an appropriate visualization can be achieved by focusing on the animation information instead of using classical geometry flip-book approaches as switching between pre-computed time steps. By encoding the trajectories of the objects we can later interpolate between them to produce smoother movements that are in phase with the rendering process even at lower frame rates. This provides several advantages as the possibility to exactly navigate through the animation to a specific moment in time and get the exact positions and stances of all rigid bodies involved in the simulation.
 |
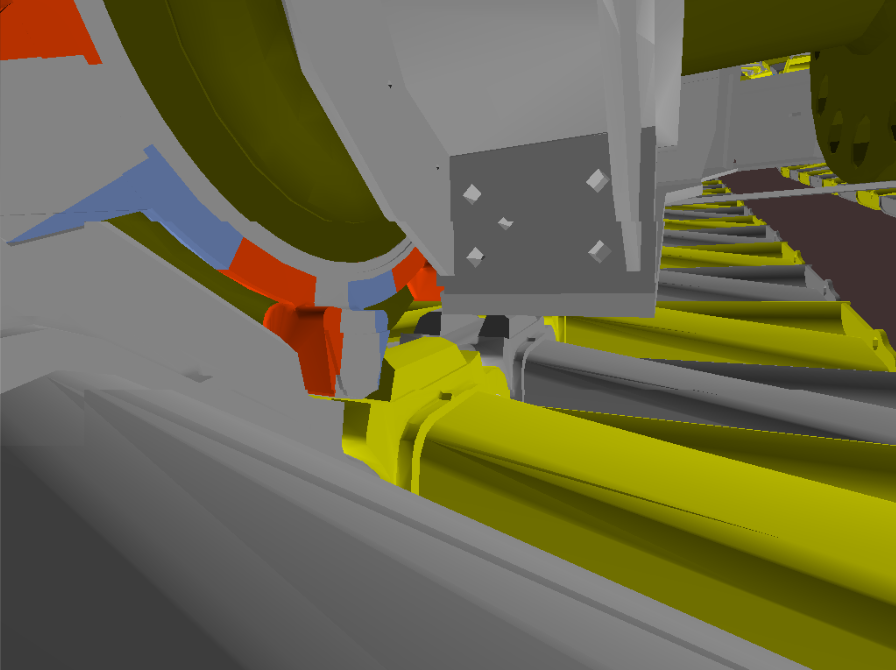 |
| Overview of an undercarriage of a bucket wheel excavator with twelve tracks (left) and detailed view on the mechanics of one track (right). | |
Back to project list - Back to top
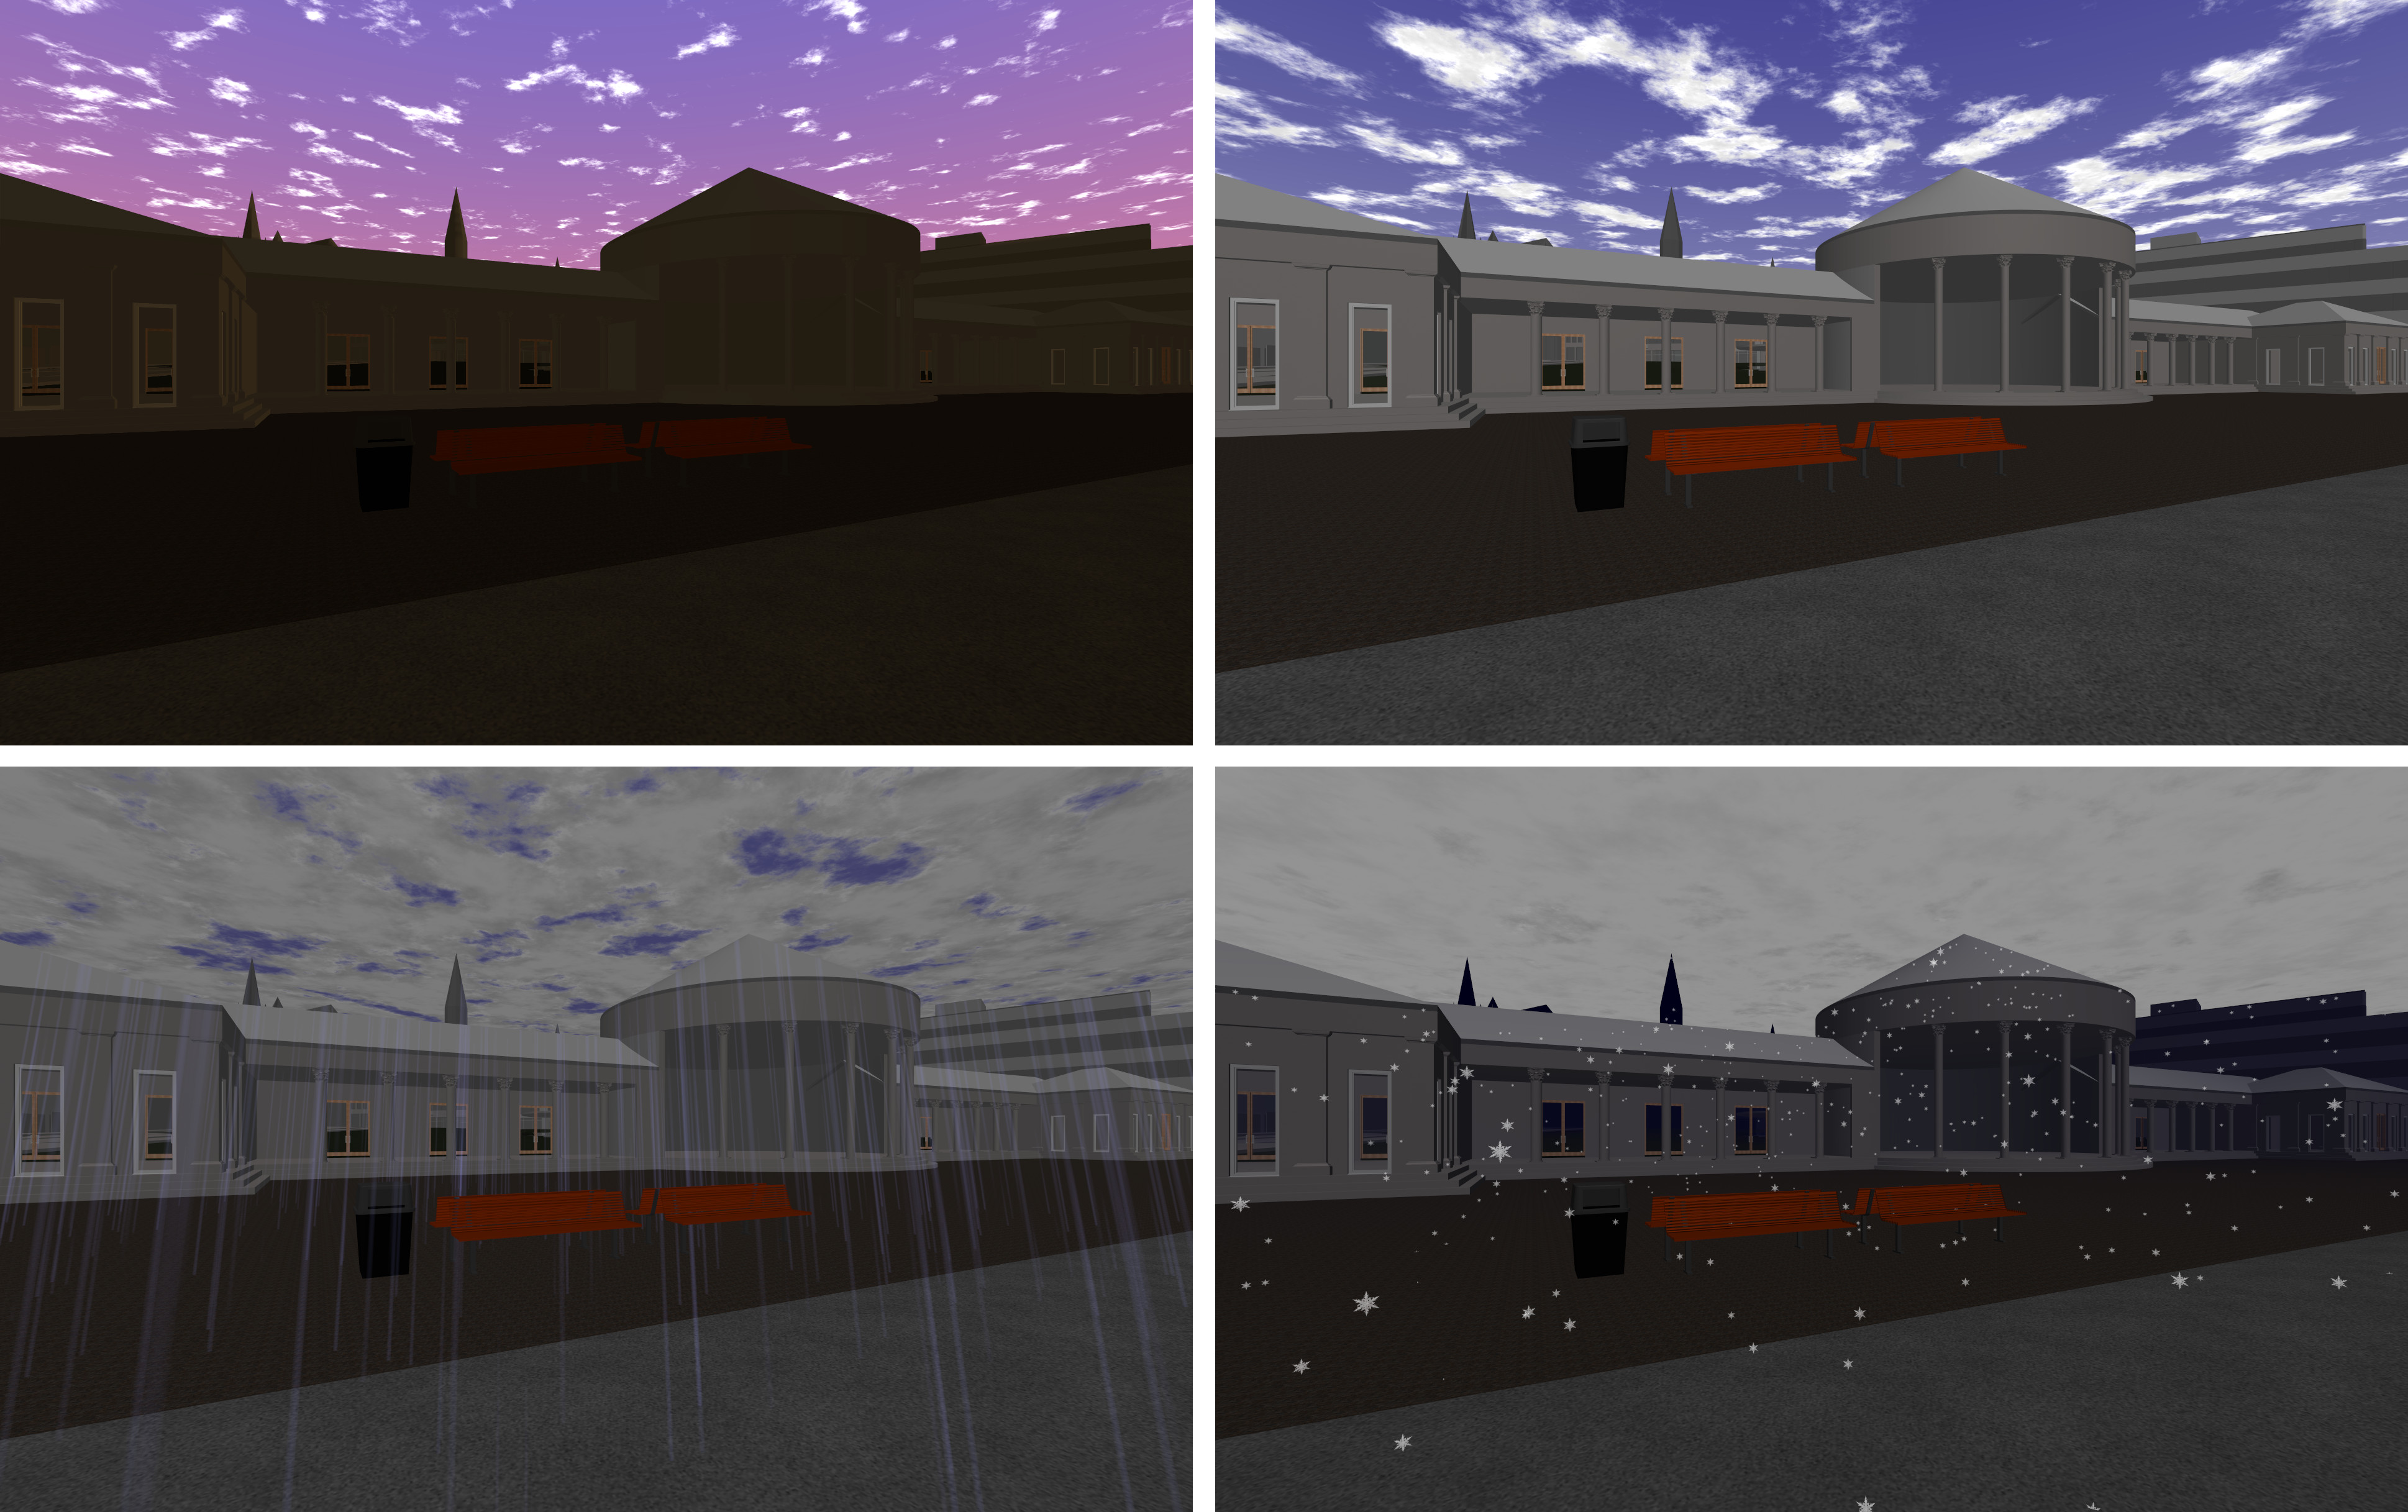
The FuEco project is a cooperative project of multiple institutes at RWTH Aachen University. Its goal is to examine and model the factors that cause stress in urban environments, in order to allow a better planning of urban areas. The examined factors include acoustic noise, weather, or air quality. For this, several measurement campaigns were conducted at different urban areas, where environmental factors were measured, and user questionnaires were used to gain information on the perceived stress of pedestrians in these areas.
To facilitate the design of future urban areas, Virtual Reality can be a helpful tool to simulate and evaluate possible urban layouts in advance. To this end, one of the locations where measurements were taken – the Elisenbrunnen in Aachen – was reproduced in a VR application to allow experiencing the scenery. To change the environmental factors, different effects of ur-ban surroundings are provided. The sound of traffic and pedestrians is simulated and reproduced in real-time. Additionally, different weather effects, like rain, fog, or clouds can be reproduced and modified interactively. The goal of this is to allow a reproduction of different environments with various effects in a Virtual Environment, in order to allow future experiments to further examine these influences on human perception in a controlled environment.
 |
|
| The virtual representation of the Elisenbrunnen with different environmental conditions. | |
Back to project list - Back to top
This project aims at the development and investigation of an innovative and future-oriented concept for an AUDI-specific human-machine interface design for inspection and diagnosis systems applied in the electrical initiation process. This concept will take the cognitive processes of the workers as well as the existing human-machine cooperation into account to finally implement a successful human-machine dialog.
The project is based on a conjoint pre-study, which provides a cognitive analysis of the inspection software using semi-structured interviews applied on-site, an evaluation of the hu-man-machine dialog out of the view of the worker’s tasks, requirements resulting from HCI and HMI research, as well as ideas identified together with AUDI and workers on site. In the first year, innovative, touch-free, and mobile devices have been evaluated according to their suitability and usability in the aimed at working environment. The second year focuses on two prototypes, which have been identified as usable options in the first year’s evaluation. Based on these hardware prototypes, alternative human-machine interfaces will be developed, which support the worker in the inspection and diagnosis process. The last year is dedicated to evaluate the newly developed concept in a focused user study that finally will be used to define a set of design guidelines, which specifies how user interfaces and hardware should be built for this sort of process in production.Back to project list - Back to top
This project focuses on forgetting of unwanted habits in the job context. It shall examine the circumstances that help employees to actually abandon habits that they regard as dysfunctional and that they wish to get rid of, and if adaptable interactive information systems can support this process. The project concentrates on behavior at the individual level and conceptualizes abandoning of a habit as a proactive process that may have implications for the social work environment. In the first project phase, it is planned to use Business Process Modelling Notation (BPMN) and Thinking Aloud Protocols (TAP) to capture and contrast work processes. The project shall examine the feasibility of a programmatic implementation of an adaptable interactive system that incorporates the previously modeled work processes and thereby controls the real work process. In a field study, individual and situational factors will be examined that help versus hinder forgetting of unwanted habitual behavior. For the second project phase, it is planned to implement and evaluate an adaptable interactive system that supports employees who wish to abandon unwanted habitual behavior.
The project is funded for a period of three years in the context of the DFG funded Priority Program "Intentional Forgetting in Organisations" under grant SPP 1921/1.
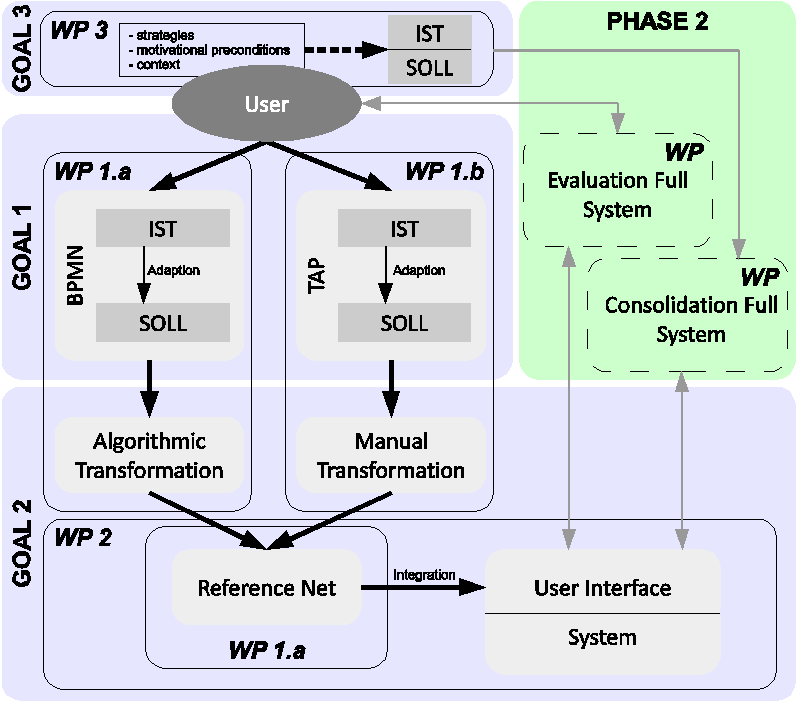 |
| Process diagram for integration of adapted models into formal interactive systems |
Back to project list - Back to top
The overriding objective of the project is to gain novel insights on enhancing skill retention of complex, dynamic, and procedural tasks with refresher interventions (RIs). There are only a few studies on skill decay and skill retention in the field of process control so far, although skill decay has been recognized as highly relevant with respect to side effects of automation. A RI is supposed to re-establish a specific skill level that was acquired at the end of an initial training after a certain time interval of nonuse. On the basis of previous experimental findings by the University of Duisburg-Essen, the project aims to analyze the impact of practice, symbolic rehearsal, and retrieval in an examination situation (testing) as RIs in the observation and control of technical (partially automated) systems. These RI approaches will be (a) examined regarding parallel and contingent (control) sequences in addition to fixed sequences, (b) examined regarding their effectiveness considering psychophysiological measures of mental workload and situation awareness, and (c) expanded with an innovative concept of a gaze-guiding user interface in which the refresher will take place at the time of retrieval. Fixed, parallel, and contingent sequences represent tasks that need to be completed in man-machine interaction in different fields of process control as well as e.g. aviation to a large part. Consideration of mental workload and situation awareness aims at gaining insights into how RIs need to be designed for often stress-inducing, abnormal situations in which skills and knowledge need to be retrieved saving as many resources as possible. Although there is some knowledge about the effectiveness of the suggested RIs, testing the effectiveness of these RI approaches for complex, dynamic tasks is novel and important. The previous research showed that results found on the testing effect or symbolic rehearsal regarding simple, non-dynamic tasks can either not be replicated with complex, dynamic tasks or the RIs induce unexpected side effects such as a higher mental workload than RIs which enhance automatization of schemas (e.g., practice RI).
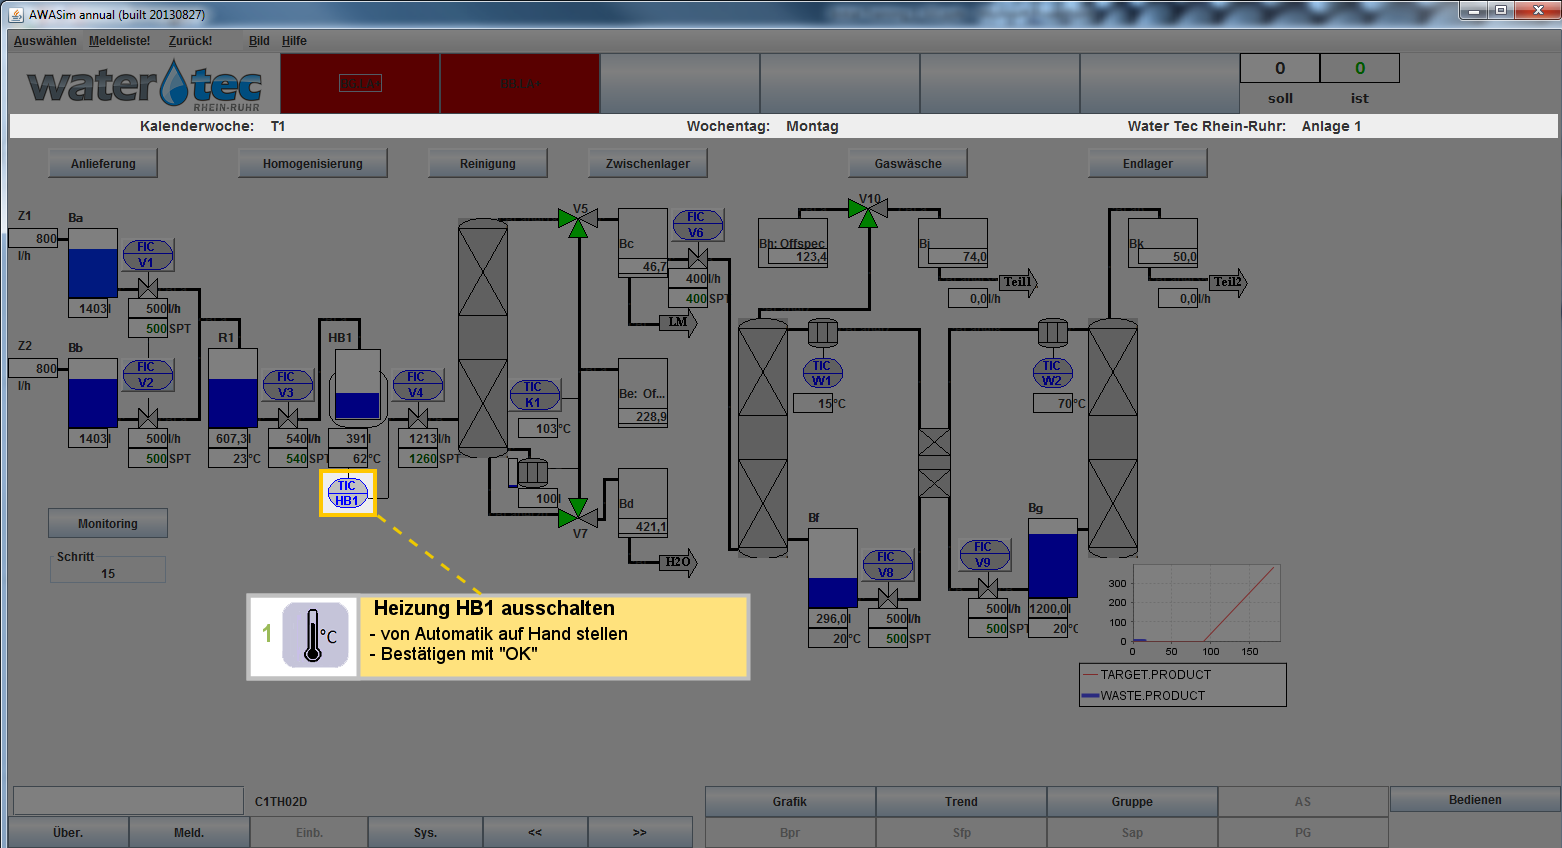 |
| User interface for steering a water treatment system. This process is used as an application scenario, here showing an example of a gaze guiding widget. |
