Profile

|
Dr. Claudia Hänel |
My research interest is on volume rendering for immersive virtual environments (IVEs). In collaboration with the Forschungszentrum Jülich I work with different data modalities in order to support the neuroscientists to discover the structure and anatomy of the brain. Visualizing such data in IVEs enhances, for example, the understanding of the spatial context. However, the challenge is to handle a fairly large amount of data with respect to the required high interactivity to retain a good user experience in a virtual environment.
- Teaching Assistant, Virtual Reality Lecture, Winter Semester 2012/2013 and Winter Semester 2013/2014
- Seminar Organizer, Current Topics in the Field of Virtual Reality, Summer Semester 2015, Summer Semester 2016, Winter Semester 2016/2017, Summer Semester 2017
- Seminar Advisor, regularly in the group's seminars and pro-seminars
- Untersuchung von Volume Rendering in immersiven Umgebungen mit Headtracking
(bachelor thesis by Adam Malatenski) - Implementation of Inflation and Flattening of the Cerebral Cortex
(bachelor thesis by Lukas Prediger) - Visualization of Particle-Traced Data
(bachelor thesis by Benedikt Thelen) - A Multiresolution Technique for Visualizing Polarized Light Imaging Data
(master thesis by Ali Can Demiralp) - Image-Based Volume Rendering Approaches for CAVE-like Environments
(master thesis by Simon Lukas Jakubowski) - Conformal Mapping of the Cortical Surface
(bachelor thesis by Tuan Nguyen)
Publications
Interactive Level-of-Detail Visualization of 3D-Polarized Light Imaging Data Using Spherical Harmonics
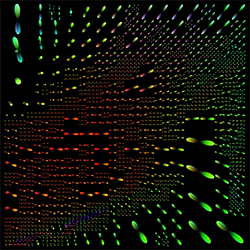
3D-Polarized Light Imaging (3D-PLI) provides data that enables an exploration of brain fibers at very high resolution. However, the visualization poses several challenges. Beside the huge data set sizes, users have to visually perceive the pure amount of information which might be, among other aspects, inhibited for inner structures because of occlusion by outer layers of the brain. We propose a clustering of fiber directions by means of spherical harmonics using a level-of-detail structure by which the user can interactively choose a clustering degree according to the zoom level or details required. Furthermore, the clustering method can be used for the automatic grouping of similar spherical harmonics automatically into one representative. An optional overlay with a direct vector visualization of the 3D-PLI data provides a better anatomical context.
Honorable Mention for Best Short Paper!
@inproceedings {Haenel2017Interactive,
booktitle = {EuroVis 2017 - Short Papers},
editor = {Barbora Kozlikova and Tobias Schreck and Thomas Wischgoll},
title = {{Interactive Level-of-Detail Visualization of 3D-Polarized Light Imaging Data Using Spherical Harmonics}},
author = {H\”anel, Claudia and Demiralp, Ali C. and Axer, Markus and Gr\”assel, David and Hentschel, Bernd and Kuhlen, Torsten W.},
year = {2017},
publisher = {The Eurographics Association},
ISBN = {978-3-03868-043-7},
DOI = {10.2312/eurovisshort.20171145}
}
Visual Quality Adjustment for Volume Rendering in a Head-Tracked Virtual Environment
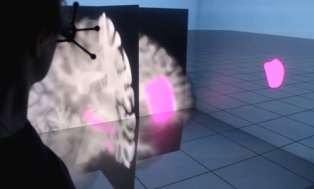
To avoid simulator sickness and improve presence in immersive virtual environments (IVEs), high frame rates and low latency are required. In contrast, volume rendering applications typically strive for high visual quality that induces high computational load and, thus, leads to low frame rates. To evaluate this trade-off in IVEs, we conducted a controlled user study with 53 participants. Search and count tasks were performed in a CAVE with varying volume rendering conditions which are applied according to viewer position updates corresponding to head tracking. The results of our study indicate that participants preferred the rendering condition with continuous adjustment of the visual quality over an instantaneous adjustment which guaranteed for low latency and over no adjustment providing constant high visual quality but rather low frame rates. Within the continuous condition, the participants showed best task performance and felt less disturbed by effects of the visualization during movements. Our findings provide a good basis for further evaluations of how to accelerate volume rendering in IVEs according to user’s preferences.
@article{Hanel2016,
author = { H{\"{a}}nel, Claudia and Weyers, Benjamin and Hentschel, Bernd and Kuhlen, Torsten W.},
doi = {10.1109/TVCG.2016.2518338},
issn = {10772626},
journal = {IEEE Transactions on Visualization and Computer Graphics},
number = {4},
pages = {1472--1481},
pmid = {26780811},
title = {{Visual Quality Adjustment for Volume Rendering in a Head-Tracked Virtual Environment}},
volume = {22},
year = {2016}
}
Towards Multi-user Provenance Tracking of Visual Analysis Workflows over Multiple Applications
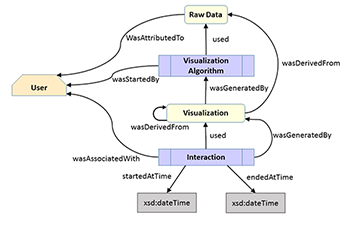
Provenance tracking for visual analysis workflows is still a challenge as especially interaction and collaboration aspects are poorly covered in existing realizations. Therefore, we propose a first prototype addressing these issues based on the PROV model. Interactions in multiple applications by multiple users can be tracked by means of a web interface and, thus, allowing even for tracking of remote-located collaboration partners. In the end, we demonstrate the applicability based on two use cases and discuss some open issues not addressed by our implementation so far but that can be easily integrated into our architecture.
@inproceedings {eurorv3.20161112,
booktitle = {EuroVis Workshop on Reproducibility, Verification, and Validation in Visualization (EuroRV3)},
editor = {Kai Lawonn and Mario Hlawitschka and Paul Rosenthal},
title = {{Towards Multi-user Provenance Tracking of Visual Analysis Workflows over Multiple Applications}},
author = { H{\"{a}}nel, Claudia and Khatami, Mohammad and Kuhlen, Torsten W. and Weyers, Benjamin},
year = {2016},
publisher = {The Eurographics Association},
ISSN = {-},
ISBN = {978-3-03868-017-8},
DOI = {10.2312/eurorv3.20161112}
}
The Human Brain Project - Chances and Challenges for Cognitive Systems
The Human Brain Project is one of the largest scientific initiatives dedicated to the research of the human brain worldwide. Over 80 research groups from a broad variety of scientific areas, such as neuroscience, simulation science, high performance computing, robotics, and visualization work together in this European research initiative. This work at hand will identify certain chances and challenges for cognitive systems engineering resulting from the HBP research activities. Beside the main goal of the HBP gathering deeper insights into the structure and function of the human brain, cognitive system research can directly benefit from the creation of cognitive architectures, the simulation of neural networks, and the application of these in context of (neuro-)robotics. Nevertheless, challenges arise regarding the utilization and transformation of these research results for cognitive systems, which will be discussed in this paper. Tools necessary to cope with these challenges are visualization techniques helping to understand and gain insights into complex data. Therefore, this paper presents a set of visualization techniques developed at the Virtual Reality Group at the RWTH Aachen University.
@inproceedings{Weyers2014,
author = {Weyers, Benjamin and Nowke, Christian and H{\"{a}}nel, Claudia and Zielasko, Daniel and Hentschel, Bernd and Kuhlen, Torsten},
booktitle = {Workshop Kognitive Systeme: Mensch, Teams, Systeme und Automaten},
title = {{The Human Brain Project – Chances and Challenges for Cognitive Systems}},
year = {2014}
}
Interactive Volume Rendering for Immersive Virtual Environments
Immersive virtual environments (IVEs) are an appropriate platform for 3D data visualization and exploration as, for example, the spatial understanding of these data is facilitated by stereo technology. However, in comparison to desktop setups a lower latency and thus a higher frame rate is mandatory. In this paper we argue that current realizations of direct volume rendering do not allow for a desirable visualization w.r.t. latency and visual quality that do not impair the immersion in virtual environments. To this end, we analyze published acceleration techniques and discuss their potential in IVEs; furthermore, head tracking is considered as a main challenge but also a starting point for specific optimization techniques.
@inproceedings{Hanel2014,
author = {H{\"{a}}nel, Claudia and Weyers, Benjamin and Hentschel, Bernd and Kuhlen, Torsten W.},
booktitle = {IEEE VIS International Workshop on 3DVis: Does 3D really make sense for Data Visualization?},
title = {{Interactive Volume Rendering for Immersive Virtual Environments}},
year = {2014}
}
Interactive Definition of Discrete Color Maps for Volume Rendered Data in Immersive Virtual Environments
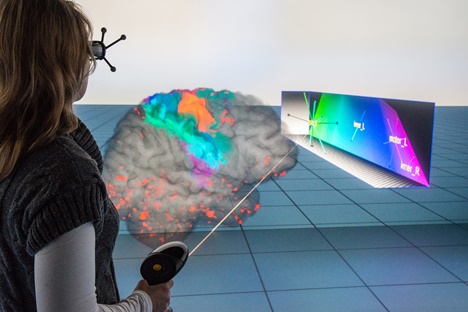
The visual discrimination of different structures in one or multiple combined volume data sets is generally done with individual transfer functions that can usually be adapted interactively. Immersive virtual environments support the depth perception and thus the spatial orientation in these volume visualizations. However, complex 2D menus for elaborate transfer function design cannot be easily integrated. We therefore present an approach for changing the color mapping during volume exploration with direct volume interaction and an additional 3D widget. In this way we incorporate the modification of a color mapping for a large number of discretely labeled brain areas in an intuitive way into the virtual environment. We use our approach for the analysis of a patient’s data with a brain tissue degenerating disease to allow for an interactive analysis of affected regions.
@inproceedings{Hanel2014a,
address = {Minneapolis},
author = {H{\"{a}}nel, Claudia and Freitag, Sebastian and Hentschel, Bernd and Kuhlen, Torsten},
booktitle = {2nd International Workshop on Immersive Volumetric Interaction (WIVI 2014) at IEEE Virtual Reality 2014},
editor = {Banic, Amy and O'Leary, Patrick and Laha, Bireswar},
title = {{Interactive Definition of Discrete Color Maps for Volume Rendered Data in Immersive Virtual Environments}},
year = {2014}
}
Interactive 3D Visualization of Structural Changes in the Brain of a Person With Corticobasal Syndrome
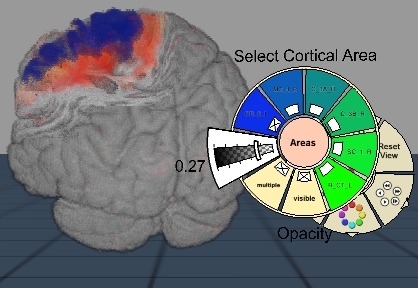
The visualization of the progression of brain tissue loss in neurodegenerative diseases like corticobasal syndrome (CBS) can provide not only information about the localization and distribution of the volume loss, but also helps to understand the course and the causes of this neurodegenerative disorder. The visualization of such medical imaging data is often based on 2D sections, because they show both internal and external structures in one image. Spatial information, however, is lost. 3D visualization of imaging data is capable to solve this problem, but it faces the difficulty that more internally located structures may be occluded by structures near the surface. Here, we present an application with two designs for the 3D visualization of the human brain to address these challenges. In the first design, brain anatomy is displayed semi-transparently; it is supplemented by an anatomical section and cortical areas for spatial orientation, and the volumetric data of volume loss. The second design is guided by the principle of importance-driven volume rendering: A direct line-of-sight to the relevant structures in the deeper parts of the brain is provided by cutting out a frustum-like piece of brain tissue. The application was developed to run in both, standard desktop environments and in immersive virtual reality environments with stereoscopic viewing for improving the depth perception. We conclude that the presented application facilitates the perception of the extent of brain degeneration with respect to its localization and affected regions.
@article{Hanel2014b,
author = {H{\"{a}}nel, Claudia and Pieperhoff, Peter and Hentschel, Bernd and Amunts, Katrin and Kuhlen, Torsten},
issn = {1662-5196},
journal = {Frontiers in Neuroinformatics},
number = {42},
pmid = {24847243},
title = {{Interactive 3D visualization of structural changes in the brain of a person with corticobasal syndrome.}},
url = {http://journal.frontiersin.org/article/10.3389/fninf.2014.00042/abstract},
volume = {8},
year = {2014}
}
Poster Interactive Visualization of Brain Volume Changes
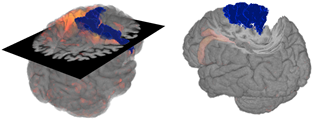
The visual analysis of brain volume data by neuroscientists is commonly done in 2D coronal, sagittal and transversal views, limiting the visualization domain from potentially three to two dimensions. This is done to avoid occlusion and thus gain necessary context information. In contrast, this work intends to benefit from all spatial information that can help to understand the original data. Example data of a patient with brain degeneration are used to demonstrate how to enrich 2D with 3D data. To this end, two approaches are presented. First, a conventional 2D section in combination with transparent brain anatomy is used. Second, the principle of importance-driven volume rendering is adapted to allow a direct line-of-sight to relevant structures by means of a frustum-like cutout.

